February 26, 2024
Shopping has always been a social endeavor. Who doesn’t love telling their friends about the amaaazing price they got on a long-wanted item? Now with that discussion happening online, merchants have an opportunity to become part of the conversation: Accenture predicts social commerce will account for over 15% of e-commerce spending by 2025. Most e-commerce companies will be relentlessly optimizing to increase the amount of that revenue that comes to them. The smart ones will be looking not just at the money but at wider social media KPIs.
It’s understandable for a retailer to focus on metrics that are directly related to sales and profits, but those numbers only give you a small part of the picture. They’re an indicator of the times you did everything right — for customers who are so perfect for your brand that they wanted to find you.
But they don’t tell you about the customer who clicked through to your site and then bounced because the navigation was weird. Nor do they tell you about the person who blocked your social feed because after liking one ad, they found themselves bombarded with unconvincing content.
Social media KPIs help you track and understand the success of your entire marketing and sales funnel. They grant you a look into potential customers’ minds and uncover weak points in your company’s shopping experience.
Here’s the social media KPIs every e-commerce company should be measuring and why they matter.
- Awareness metrics
- Consideration metrics
- Purchase metrics
- Going full-funnel with social media KPIs
- Connection is the future of social commerce
Awareness metrics
Customers will only come to you if they know your company actually exists. Awareness marketing can be hard to make a case for, especially in a revenue-driven outfit. Campaigns to teach people about your company don’t translate into immediate or direct sales. These efforts are further upstream than that — but if they don’t happen, your company won’t get the downstream benefits.
There’s three major awareness KPIs you can (and should) track to show that your awareness efforts are making a difference on social media.
1. Impressions
Your impressions, or views, track how many times a post was seen. The number of impressions you get is not equal to the number of people you reach. Some people may see your content more than once, either by revisiting it, seeing it shared multiple times, or even encountering it on different platforms.
Impressions are useful in determining whether you’re visible to the audiences who want to see you. This metric may fluctuate from week to week, which is normal. But in the long term, you want an upward trend to show that your social output is reaching more people.
Impressions benchmarks
Industry-wide benchmarks for impressions may not help you because a small e-commerce brand won’t have the same reach as a large multinational corporation. Likewise, a brand that shoots for a niche audience can’t expect the same reach as one that’s going for the least common denominator.
You could look at your direct competitors’ posts to see how they’re doing, or you could just track numbers internally and compare today’s operations to those of last year.
Increasing your impressions
The key to reaching more people with your posts is constant engagement with a platform. You should always be posting new content and interacting with your followers. As you do so, you’ll begin to learn what works best for your brand on each platform; following those trends will lead to more impressions.
2. Followers and community growth
Hopefully, some of the people who see your content (“impressions”) will decide they want to become a part of your community. Follower numbers matter because they represent the people who decide they want to see more from your brand. They’re signing up to hear your sales pitch so you can reach them without paying for ads.
When looking at follower numbers, keep in mind that some accounts will follow you and then go dormant. Therefore, if your follower numbers aren’t actively growing, your actual audience size is likely shrinking.
Increasing your follower numbers and community size
Give people a reason to follow your account by being more than just a bulletin board for bland announcements written in brand-speak. Many accounts have success with giveaways, either entering new followers into a raffle or sending a coupon code to those who sign up for updates.
Just know this “hack” only works if you have a plan to keep those followers around.
3. Social engagement rate
Social engagement tracks how often your audience interacts with your content. Engaged audiences are worth more than passive ones; only those who have some level of emotional involvement will watch your videos and like or share your posts.
It’s worth noting that certain types of engagement are worth more: Someone who follows a link to your store is more likely to buy your product than someone who watches a short brand video. However, watching that brand video may lead to a future link click, so don’t focus only on the engagements that lead to imminent conversion.
Social engagement rate benchmarks
According to Rival IQ, the median engagement rate across platforms (per post) is:
- Facebook: 0.06%
- Instagram: 0.47%
- TikTok: 5.69%
- X (Twitter): 0.035%
Increasing your engagement
As long as you’re not buying followers (don’t ever do this, by the way!), your engagement should increase as your impressions do. There’s a ton of ways to increase your social media engagement and conversion rates, so test out multiple approaches to see what works.
Two of our favorite tips: first, interact with the people who interact with you. Second, share your community’s user-generated content (UGC). People love it when their posts get attention from an official brand account, and showing a bit of personality makes your brand seem more authentic.
Consideration metrics
After awareness, would-be customers enter consideration mode — they start thinking about whether they want to buy from you and become the type of person who uses your products and associates with your brand. Some shoppers quickly move from consideration to conversion, but others linger in this phase for a while.
These are the social media KPIs you can track to learn more about both types of buyers — and how you can win them over more efficiently.
1. Site traffic
Any person who comes to your site is interested — at least briefly — in becoming a customer. In e-commerce terms, visiting a site is like picking up a product off the store shelf to look more closely or taking a piece of clothing to the fitting rooms. Your site visitors have found enough value in your social media presence to evaluate your brand more closely.
For specific KPIs numbers, you’ll need to dig into Google Analytics data to determine how much of your site traffic came from your social media efforts and what campaigns drew visitors.
Site traffic benchmarks
Most online retailers don’t publish raw traffic numbers, much less traffic numbers broken down by source. However, you can use your site traffic data to reverse-engineer your social media click-through rate. Chatdesk published the following click-through rate benchmarks:
- Instagram: 18% (organic posts) and 18% (ads)
- TikTok: 14% (organic posts) and 2.3% (ads)
- Facebook: n/a (organic posts) and 9% (ads)
Alternatively, simply use internal benchmarks for those raw traffic numbers.
Improving your site traffic
Since site traffic depends on your social media click-through rate, you’ll want to focus on the posts that are bringing visitors to your site. Make sure your link cards give an accurate description of your site and include eye-catching imagery.
Every post with a link should include a clear CTA that tells people what they’ll get by clicking through. And, most importantly, you have to follow through on that promise. Someone who clicks through and has a disappointing experience is less likely to follow your links in the future.
2. Lead generation
Gathering email addresses or phone numbers of interested shoppers helps you close the deal if they’re not ready to buy quite yet. Winning a social media follower is like getting your foot in the door. Think of someone giving you their contact information as inviting you in for a cup of tea (or coffee — your choice).
You can continue to nurture leads by adding them to a newsletter that shares your values and highlights UGC to show your product in the wild. Or, you can send them coupons and notifications about sales to convince them to buy.
Lead generation success benchmarks
No one has benchmarked lead generation success rates, perhaps because it’s a difficult thing to measure (and definitions of “what counts” may vary by company). We do know pop-ups that ask for visitors’ emails have an average conversion rate of 3.8% though. While this data appears to be largely e-commerce-focused, it’s not broken down by industry.
It may be best to compare your performance to internal social media benchmarks on this one for now. Your lead generation rate KPIS specific to social media followers should at least equal, if not exceed, your overall lead generation rate.
Increasing your leads generated
Customers often don’t want to give out their contact information (for good reason — how many times have you signed up for an email list and gotten five emails per day about “can’t miss” deals?).
You can try the dreaded pop-up that promises a coupon or discount in exchange for contact information, or you can request it in a less aggressive manner. There are many clever e-commerce lead generation techniques that start with a useful, and therefore less annoying, interaction.
If your social media efforts are bringing in a lower percentage of leads, it may be time to reconsider your audience and targeting strategy. A smaller, more engaged audience can be better when you curate a list of followers who are actually likely to buy from you.
3. Site visits (number of sessions)
How many times does the average person come to your site before buying a product? If you know this, you know how many times you should be trying to get prospective customers to visit.
Someone who’s been to your site once may not be the best person to retarget with an ad if you can spend that same money on someone who’s already browsed it three times in the past month.
Site visits benchmarks
Your audience’s behavior is unique, so this is a metric that relies on internal benchmarks. It’s also a number you don’t need to worry about improving — it’s just important to know.
Pull this information from Google Analytics (or your chosen analytics software) by looking at your user sessions. To get the most valuable data, you’ll have to dig into the session attribution statistics. There, you can see how often people visit before they buy and whether visitors from different sources have different behavior patterns.
Increasing site visits
Like site traffic, it’s tempting to think this metric is about things outside of your site. After all, you just have to post another link and people will click through, thus taking themselves a step closer to buying from you. Right?
Not exactly. That CTA and link won’t be as effective if someone’s first visit to your site was a pain. Slow-loading pages, confusing navigation, and hard-to-read text can drive visitors away.
You should think about ways to remind potential customers you exist, but it’s even more important to make sure interacting with your brand is a joy. Shoppers who know they’ll have fun browsing your site are more likely to come back.
4. Time on site
The amount of time a visitor spends on your site indicates their engagement. Thirty seconds is about enough time for them to scroll down whatever page they landed on and then click away. In a minute, they can browse a category of products and see if you have the type of item they’re looking for.
Someone who spends ten minutes likely looks at multiple products, reads up on them, and checks out ratings and reviews. (Make sure it’s 10 minutes of activity, though, and not 10 minutes of “let me just check this email really quick in another tab.”)
Time on site benchmarks
This is another benchmark you can gather yourself using Google Analytics. Google will track someone’s time on page, which is a specific measurement per URL. So, you may see someone spend 30 seconds on your homepage, 15 seconds on a category page, and then three minutes on each of two product pages.
Altogether, this would give them an engaged time of six minutes and 45 seconds. Both time on page and engaged time duration are important but in different ways.
Increasing time on site
There are two ways to approach convincing people to spend more time on your site. The first is by looking at the average time on page for each of your site’s pages. Are there any outliers? Some page types may lend themselves to shorter visits, but big variations between pages of the same type may indicate differences in user experience.
Second, ask how you can extend a user’s engaged time. The most important thing to consider here is whether your CTAs match a user’s experience. Someone who clicks through to see your massive clearout sale and then gets bounced to your homepage rather than a catalog of on-sale items will likely bounce.
Purchase metrics
At last, the metrics your CEO probably cares most about — money. 🤑 Now that you’ve been tracking users through the rest of your marketing and sales funnel, you have the context you need to tell a bigger story using these metrics.
After all, no purchase would happen without the awareness and consideration components you worked on.
The most difficult part of handling purchase metrics is thinking about attribution. Someone who learns about your brand through Instagram and signs up for your email list because of an Instagram post might end up making a purchase after clicking an email link.
If you’re not using multi-touch attribution, the email campaign would get all the credit for that buy. That’s not fair to your social media efforts and KPIs — nor is it good data to base business decisions on.
1. Revenue
This metric may be officially in the domain of your accounting team, but there’s no reason you can’t track it as well. When looking at revenue, you can track gross (all earnings) or net (earnings minus expenses) as your company prefers.
Revenue benchmarks
When measuring the revenue your social posts brought in, you’ll want to look both at past earnings and future projections. Calculate the percentage of revenue you can attribute to social posts, then multiply that number by your company’s revenue predictions to get the benchmarks you’re aiming for.
Increasing your revenue
Effective CTAs are part of the equation to increase revenue, and you should already be working on those. You also want to make sure customers have a clear path to purchase (and get the deals you talked about, if relevant) either directly through your social channels or when they land on your site.
For paid social efforts, ask how you can decrease your customer acquisition cost. This move won’t impact gross revenue, but it will increase net revenue.
2. Transactions
Having more buyers is always a good thing. Not only does it bring in more revenue, but it also means you have a wider base of customers to solicit for return business. The number of completed transactions is also a measure of how easy it is for visitors to make a purchase after landing on your site.
Transaction benchmarks
It’s natural for transaction rates to ebb and flow across e-commerce. The holidays typically see more sales, and various industries have different peaks at different times of the year. You may do best to compare directly across times of year.
For example, did your company process more transactions during December of this year than it did during December of last year?
Increasing your number of transactions
Since many shoppers (and social users) are accessing your site via mobile, you need a mobile-friendly shopping experience. You’ve already done your part to make sure your CTAs are fulfilling their promises. Now it’s time to dig into how your site can best serve your social audience as a whole.
Work with your website team to learn about the transactions that don’t happen. You should be tracking your shopping cart abandonment rate to see why buyers back out at the last minute. Often, convenience is the issue
But, if your abandonment rates are higher among visitors from social specifically, you may want to ask how your posts can better prime shoppers for the checkout experience. If you’re approved for shopping on platforms like Instagram, reassess your digital storefront:
- Are your posts filled with rich visual UGC that entices browsers to shop?
- Do you showcase ratings and reviews?
- Is the in-app shopping experience smooth, or are you forcing people to click through to your website?
All these factors affect a shopper’s decision to follow through with a transaction.
3. Conversion rate
How many of your social media click-throughs turn into purchases? This is your conversion rate, and it’s a number that can tell you a lot about your overall brand perception.
There’s plenty of reasons a customer might not convert. Maybe your prices are too high, maybe they find your site annoying, or maybe you don’t ship to their country. Not all of these are things you can (or even need to) fix.
But, if the shopping experience is getting in the way of users making a purchase, it’s time to step in.
Conversion rate benchmarks
BigCommerce tells us a good e-commerce conversion rate is around 2-3%. That’s pretty low — but if your social media visitors are buying at that rate, then you’re doing well.
Increasing your conversion rate
Your conversion rate affects the revenue and transaction metrics you’re measuring, and you improve all three in the same way. A smooth, fun shopping experience is a must if you want customers to convert.
Also, keep in mind that customers coming from a social link are likely responding to the offer in the post. They’re not here to browse, so don’t try to force them through extra steps before they can make a purchase.
If you can steal some more time with your website team, try our top 10 tips to improve your conversion rates. You’ll be able to help each other with these efforts.
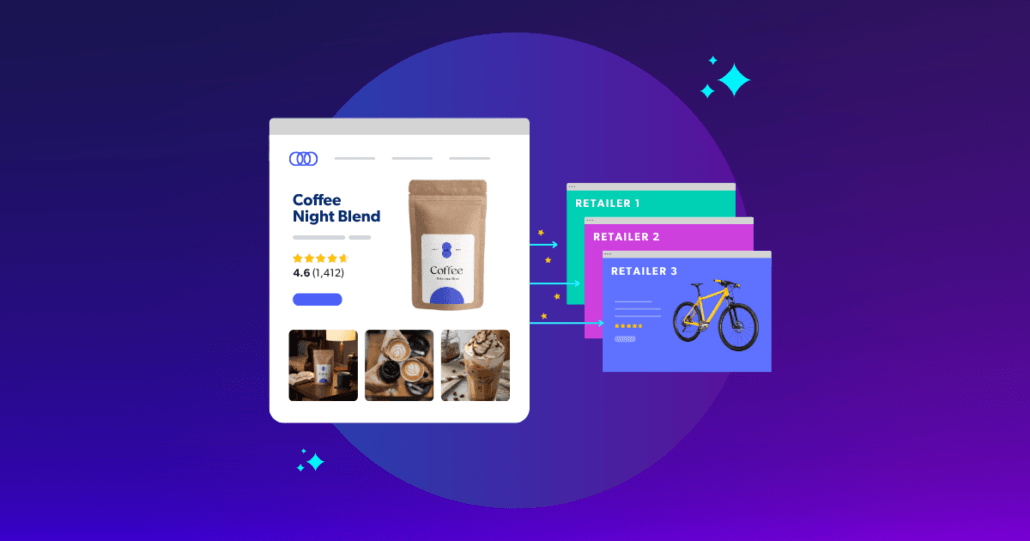
And if you’re selling directly on social, look for opportunities to optimize the experience. Like2Buy, for instance, is a tool that turns your Instagram pictures and videos into informative, directional, or shoppable posts. The transition from liking a post to buying a product from your store becomes a seamless process for shoppers.
4. Average order value
Shoppers often pick up a few tempting extras when they go to the store. Convincing them to mimic this behavior online will help your company. Obviously, more items bought lead to a higher average order value (AOV), which means higher revenue (gross or net).
Customers who buy more are also putting more trust in your brand. If you deliver on your promises, they’ll be that much more likely to come back the next time they need the type of products you sell.
Average order value benchmarks
There’s no e-commerce benchmark for this metric because it’s very dependent on your products and customer base. Your accounting team is likely already tracking this metric, so see if they have historical data — and if not, start gathering it now to set an internal benchmark.
Increasing average order value
Growing your AOV is all about giving customers who are already buying a reason to splurge. Get your social media audience excited to spend by promoting offers that encourage them to .Free shipping over a certain amount? Tell them in the ad. Do loyalty program members get points for every dollar spent? Use your post copy to remind shoppers they can get more by spending more.
The methods that work best vary based on the type of product you’re selling and your customer profile, so try a few techniques to nail down which is most effective.
Going full-funnel with social media KPIs
Hopefully, by this point, you can see the direct link between awareness, consideration, and purchase metrics — but you work in marketing. Stakeholders in other parts of the business may not understand these ties as well as you do. As you’ve seen, some of these metrics require cross-department collaboration to gather. They also require collaboration to build.
If your leadership (or other department stakeholders) don’t buy into this approach, it’s helpful to frame it as an examination of today’s market. People don’t find products directly in stores anymore. They go online, do research, and often buy straight from their social feeds.
Every cent of revenue a brand earns depends on shoppers being able to find your brand when they’re doing that research and then being impressed by what they see.
Buyers typically have multiple touchpoints with a brand before they make a decision. They’re often navigating the awareness and consideration phases at the same time. Your online presence — social, site, and beyond — must account for this behavior by offering shopping content in places where people go to learn, and educational content in places people go to buy.
Here’s how to bring your efforts together.
Set shared goals
What KPIs are more important for your social media channels this month — impressions or site traffic? Social engagement or on-site conversion rates? When your company sees these metrics as competitors, you’ll end up shafting efforts that need to be collaborative.
Get everyone in the same room to talk about foundational goals so you can identify how the metrics you’re tracking work as indicators for other teams as well. With this shared baseline, it’s easier to remind other departments how that action item you asked for to support your goals will also help them meet theirs.
Take it slow
Creating a full-funnel social content and commerce strategy is a difficult task, and if you’ve never done any of this before, give yourself space to learn and grow.
Yes, you’ll eventually want to have branded content and UGC at every touchpoint. But when you start with perfecting operations on one platform, you’re making the wise choice to build a foundation that you can scale. Later.
Appoint a “UGC coordinator”
UGC is central to bringing the awareness, consideration, and purchase behaviors together. That puts it at risk of becoming a secondary issue in each of those areas because no one wants to step on anyone else’s toes.
Beat this tendency by choosing someone to own UGC efforts, and — this is important! — make sure they have the authority and sway to implement their strategy across multiple teams and departments.
Bring the social to your site
Social commerce doesn’t only live on social networks. When you integrate UGC into your site, you’re giving people the chance to see what real customers have to say about your products.
They don’t have to go searching for that valuable social proof, so you’ll see your conversion rate improve. There’s no need to integrate UGC into every product page off the bat. Start with a fun gallery on your homepage to see the promise of this technique in action.
Build a UGC “treasure trove”
UGC, like any marketing asset, can be used more than once. Set up a central UGC database or library where you share the best pieces of UGC. How you organize this collection is up to you, but make sure you have some way for everyone to search by product type/line, content type, etc.
Connection is the future of social commerce
With all the content on the internet, people are turning more to one another for trusted advice and reviews. Company-generated marketing materials aren’t dead yet, but they work best when they’re paired with UGC. And when you can integrate your brand communications and your fans’ contributions into the entire marketing and sales funnel, you’ll add authenticity to your communications.
That means your metrics — the social media KPIs and those more related to your site and sales — will keep going up.
Curating UGC can be a job of its own unless you have a strong platform supporting you. Our Social Commerce solutions help you curate the best of the best (now with AI assistance and recommendations!). We track UGC’s performance as part of your marketing campaigns and sales efforts to return full-funnel metrics — like the ones in this piece. In short, it’s easy for you to execute on your strategy and tell stakeholders the story of how your work is important.
Your social media KPIs are only one slice of the pie. If you’re hungry to learn more about the future of social commerce, check out our social commerce conversion e-book — it’s full of tips to help you integrate UGC into every consumer touchpoint and help you measure the impact of that work.