September 4, 2023
Gartner and Harvard Business Review, amongst others, frequently report about marketers’ lack of knowledge for how to measure the success of multi-channel and omnichannel marketing. This article addresses that problem — and offers the solutions — by demonstrating why multi-touch attribution is the best way to track performance and determine success.
Chapters:
- What is multi-touch attribution?
- How to collect the right data for multi-touch attribution
- Multi-touch attribution and the customer journey
- Types of multi-touch attribution model
- Multi-touch attribution tools for a privacy-first world
- Data won’t tell you everything
In a privacy-first world, legacy approaches to multi-touch attribution are neither accurate nor reliable. Ad services like Meta and Google continue to remove user-level tracking capabilities from their reports in response to regulations, and marketers who rely on third-party cookies to quantify the mid-funnel are doomed.
User-level data is less reliable than ever and low accuracy isn’t a winning start to data-driven decision-making.
So, what are data-driven marketers to do — go back to the siloed, single-touch attribution models of Web 2.0? In an omnichannel landscape where consumers interact with brands across channels prior to a conversion, single-touch attribution doesn’t make sense. An effective marketing strategy requires a cohesive set of tactics that build on each other’s efforts to create and maintain momentum in a focused direction.
Single-touch attribution only allows marketers to look at one tactic at a time, usually in the discovery or conversion stages. Marketers who rely on single-touch attribution to understand multi-channel strategies risk myopic decision-making by ignoring critical mid-funnel tactics. Brands need a fuller picture of what’s contributing to success to make informed multi-channel decisions.
What is multi-touch attribution?
Multi-touch attribution is a marketing model that measures every touchpoint on the customer journey by assigning a numerical value to each channel so that marketers can see the impact each touchpoint has on conversions.
The mid-funnel is hard to measure, but investing resources in quantifying the mid-funnel pays off. Mid-funnel marketing makes a brand’s acquisition efforts more successful by lifting conversion rates across multiple channels. It also smooths the path to retention by building advocacy early, improving LTV, and taking pressure off of customer acquisition.
Multi-touch attribution — assigning value to every stage of the customer journey — is still an important framework, but today’s version is a far cry from the third-party cookie-based approach marketers used to love.
How to collect the right data
Third-party data collected through pixels and cookies used to be the primary source of multi-touch attribution. If a marketer wanted to track user behavior across channels, devices, and platforms, they just had to add a snippet of code to their website. Traffic would get tagged with a Facebook or Google cookie automatically without the user’s consent. That cookie would follow the user around the web to watch what they did and retarget them with relevant ads. Marketers would aggregate data from third-party cookies into multi-touch attribution reports to understand user behavior and optimize customer journeys.
Today, that same user-level data is harder to access. GDPR and CCPA prompted Google, Facebook, and other platforms to phase out third-party cookies, a move that forced marketers to abandon tried-and-true methods of multi-touch attribution.
Data-driven marketers have started to adapt to the new analytics landscape, leveraging first-party data and zero-party data to quantify performance across the marketing funnel.

The distinction between zero-party data and first-party data is relatively new. Until recently, all data that a brand collected was considered “first-party.”
Today, first-party data refers to quantitative behaviors that a brand tracks through their interactions with customers. First-party cookies, tags, and urchin tracking modules (UTM) are the common methods consumer brands use to collect first-party data. Omnichannel retailers might also track brick-and-mortar store visits in tandem with e-commerce customers’ behavior, like cart abandonment and email clicks. GDPR-compliant cookies can replace some of the metrics marketers used to track using third-party cookies.
Using them properly requires a privacy-first strategy that asks for consent and allows users to request that their personal data be deleted.
Zero-party data refers to qualitative information a customer tells a brand voluntarily. Customer support conversations, product reviews, survey responses, and social media comments all fall under the umbrella of zero-party data. Qualitative customer data can be invaluable to a brand if leveraged properly, but finding meaningful insights in text can be challenging to marketers used to relying solely on quantitative reports.
In an era of increased regulations and phased-out tracking systems, the best consumer marketers rely on Bazaarvoice’s zero-party qualitative insights to illuminate buyer journeys and find opportunities for growth.
Multi-touch attribution and the customer journey
Using multi-touch attribution in multi-channel marketing uncovers tactics to increase conversion rate, reduce average time to purchase, and improve average order value (AOV).
Marketing tactics don’t exist in a vacuum — they exist in a multi-channel ecosystem. Giving full credit to any one tactic through single-touch attribution, no matter where it lies in the customer journey, ignores everything else that plays a role in customer acquisition. A brand’s relationship with prospective customers in the mid-funnel is crucial to earning more business and increasing revenue.
In a multi-channel marketing landscape, multi-touch attribution is the key to understanding what’s working and why. Consider this fictional six-step purchasing journey for a $500 Dyson vacuum cleaner.
| Funnel stage | User behavior | Data collection method |
|---|---|---|
| DISCOVERY | A user searches for “cordless stick vacuums” on Google. They click on a search ad and view a product page on Dyson’s website. | First-party cookie on Dyson’s website |
| AWARENESS | The user pauses to watch a retargeting ad for the vacuum while browsing Instagram and scrolls past it without clicking. | Facebook Ad Insights |
| AWARENESS | The user sees another retargeting ad, this time on TikTok. The ad is user-generated content (UGC) of a person raving about her Dyson cordless vacuum. | TikTok Ad Insights |
| CONSIDERATION | The user discusses the purchase with their partner over dinner while perusing options on Dyson’s website. | First-party cookie on Dyson’s website |
| CONSIDERATION | The user reads a Substack newsletter that recommends the Dyson vacuum. They click on an Amazon affiliate link and add the vacuum to their cart. | Amazon Affiliate Report |
| CONVERSION | The user gets an email alert from Amazon that the vacuum’s price dropped to $500. They purchase the vacuum. | Amazon Listings Report |
Using first-touch attribution, a marketing team might conclude that paid search was a clear winner. But paid search isn’t the full story. Dyson might not drive as many conversions without social proof from UGC and affiliates, which first-touch attribution can’t illuminate.
If Dyson relied only on last-touch attribution, the team might decide to build their marketing strategy on discounting — a tricky move for a premium market player. Dyson’s products are unapologetically expensive, a pricing strategy that works because of Dyson’s proprietary technology and strong brand. Heavy discounting would counteract Dyson’s brand superpowers instead of complementing them, creating a race to the bottom that nobody can win.
Multi-touch attribution gives Dyson a better understanding of their paths to conversion, which presents more options for experimentation. Since UGC is known to improve conversion rate and plays a role in their (fictional) customer journey, Dyson might decide to experiment with more UGC ads the following quarter to increase revenue.
Types of multi-touch attribution model
Consumer marketers use linear, J-shaped, inverse J-shaped, and U-shaped models to attribute performance across the customer journey.
Linear attribution gives equal weight to every stage along the customer journey and gives marketers a balanced view of the path to conversion. It gives more credit to mid-funnel tactics than other models, which can be useful when focusing on the mid-funnel for the first time.
It’s a good starting point, but it might inflate the value of unimportant interactions and undervalue crucial tactics. Linear attribution modeling can therefore help marketers challenge their own assumptions about what works but is rarely accurate enough in the long term to work for every scenario.
A traditional J-shaped model assigns more credit to the last stages of the customer journey, while an inverse J-shaped model puts more weight on the beginning stages of a customer journey.
U-shaped models, also called position-based models, assign equal weight to first and last touch with a smaller percentage attributed to everything in between.
Let’s look at how each type of multi-touch attribution would assign value to our fictional $500 vacuum buyer’s journey.
| Fictional buyer’s journey: cordless vacuum | Linear attribution | J-shaped attribution | Inverse J-shaped attribution | U-shaped attribution | First-touch attribution (single-touch) |
| The user searches “cordless vacuums” on Google. They click on a search ad that takes them to a Dyson product page. | 16% ($80) | 20% ($100) | 60% ($300) | 40% ($200) | 100% ($500) |
| The user sees a retargeting ad for the vacuum while browsing Instagram but scrolls past without clicking. | 16% ($80) | 5% ($25) | 5% ($25) | 5% ($25) | 0% ($0) |
| The user sees a Dyson vacuum ad on TikTok. | 16% ($80) | 5% ($25) | 5% ($25) | 5% ($25) | 0% ($0) |
| The user discusses the purchase with their partner while looking at options together on Dyson’s website. | 16% ($80) | 5% ($25) | 5% ($25) | 5% ($25) | 0% ($0) |
| The user reads a Substack newsletter about the Dyson vacuum. They click an affiliate link and add item to cart. | 16% ($80) | 5% ($25) | 5% ($25) | 5% ($25) | 0% ($0) |
| The user gets an emailed that the vacuum’s price dropped to $500. They purchase it. | 16% ($80) | 60% ($300) | 20% ($100) | 40% ($200) | 0% ($0) |
The attribution model a brand chooses depends on their scenario, priorities, and philosophies. Teams that are focused on building discovery might use an inverse j-shaped model to understand the beginning stages of their customer journey, while teams that are focused on the mid-funnel might apply a linear model to generate insights.
Leveraging a multi-touch attribution model in multi-channel marketing
Here’s a scenario: a children’s apparel brand wants to find growth opportunities for their e-commerce channel.
Using first-touch attribution, the team concludes that unbranded paid search traffic has a higher average order value (AOV) than customers acquired through paid social but generates less revenue overall.
If they stopped there, the apparel brand might conclude that despite the lower volume, paid search is a better use of their time and money. That could make sense but would increase end-of-month (EOM) revenue by a relatively small margin.
| Fictional model: children’s apparel brand | Baseline: Paid search | Baseline: Paid social | SCENARIO A: Invest more budget into paid search |
| AOV | $99 | $79 | $99 |
| Conversion Rate (first touch) | 1.5% | 0.5% | 1.5% |
| New Visits | 10,000 | 500,000 | 20,000 |
| Conversions | 150 | 2,500 | 300 |
| Revenue (first touch) | $14,850 | $197,500 | $29,700 |
| Revenue Lift | $14,850 |
Baseline EOM Revenue: $212,350
Pairing a multi-touch attribution model with a first-touch report gives the team more options.
When they run a buyer’s journey report in Segment, the team discovers that higher-AOV buyers from paid search traffic tend to visit a testimonial page on the store in the days preceding a purchase. The page highlights reviews from happy customers and is linked on product pages.
Since the brand is looking at performance from an acquisition standpoint, they decide to use an inverse J-shaped model to understand the path to conversion from paid search, a high-AOV customer journey.
| Fictional paid search customer journey: children’s apparel AOV: $99 | Value of interaction (Inverse J-shaped attribution) | Value of interaction (First-touch attribution) | Data collection method |
| The user searches for “back to school outfits” on Google. They click on a search ad that takes them to a collection page. The user adds a few things to their cart but closes the window without purchasing. | 60% ($59) | 100% ($99) | First-party cookie |
| The user clicks on a cart abandonment email that takes them to their cart. They visit a product page for children’s jeans and click on a link to the testimonial page. They open five customer images and expand seven reviews. | 10% ($10) | 0% ($0) | Email insights, heat maps |
| The user sees a retargeting ad on Instagram for the jeans but scrolls past without interacting. | 10% ($10) | 0% ($0) | Facebook Ad Insights |
| The user gets an email alert that the clothing brand is running a back-to-school sale. They click on the email, add the jeans to their cart alongside a few shirts, and purchase. | 20% ($20) | 0% ($0) | Email insights, first-party cookie |
After comparing the relative value of each interaction to those from lower-AOV buyers’ journeys, the team decides to direct paid social traffic to the testimonial page through a retargeting campaign, which might increase AOV from that channel.
Enter Scenario B: Leverage UGC, in this case ratings and reviews, to improve AOV and get more revenue from paid social. The team hypothesizes that AOV from paid social will increase to $99 as a result of the experiment. If it works, the experiment would increase revenue by a greater increment than Scenario A.
| Fictional model: Children’s apparel brand | Baseline: Paid Search | Baseline: Paid Social | SCENARIO A: Invest more budget in Paid Search | SCENARIO B: Direct Paid Social traffic to the testimonial page |
| AOV | $99 | $79 | $99 | $99 |
| Conversion Rate (first touch) | 1.5% | 0.5% | 1.5% | 0.5% |
| New Visits | 10,000 | 500,000 | 20,000 | 500,000 |
| Conversions | 150 | 2,500 | 300 | 2,500 |
| Revenue | $14,850 | $197,500 | $29,700 | $247,500 |
| Revenue Lift (compared to Baseline EOM Revenue) | $14,850 | $232,650 |
Baseline EOM Revenue: $212,350
Multi-touch attribution puts complementary tactics in context, giving a team what it needs to make nuanced decisions with the constraints of their market and the strengths of their organization.
Multi-touch attribution tools for a privacy-first world
Bazaarvoice’s suite of omnichannel commerce tools is the best way to collect zero-party data.
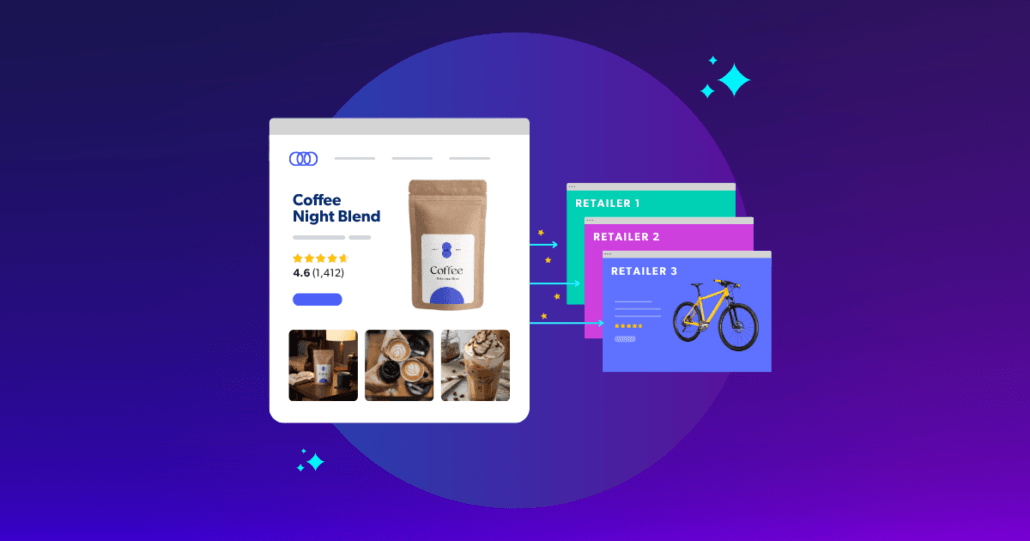
Hardys Wines, the UK’s #1 wine brand, uses Bazaarvoice to collect zero-party data through ratings and reviews, two of the most important contributors to a purchasing decision. After syndicating reviews across retailers through Bazaarvoice’s platform, Hardys increased their review volume by 2,300% and improved their average star rating from 4.32 to 4.59.

Since many online shoppers filter results to show products rated 4.5 stars or higher, Hardys was able to get in front of more potential customers, building revenue across multiple channels with one mid-funnel tactic. Insights & Reports inside Bazaarvoice helps brands like Hardys maximize the value of zero-party data.
Pair Bazaarvoice’s tools with an owned marketing platform like Klaviyo to collect behavioral data that complements zero-party qualitative insights. Klaviyo’s customer profiles allow brands to map buyer journeys at the user level and then deliver a personalized experience through their suite of email and marketing tools.
Leverage aggregation tools like Segment to quantify the customer journey across channels and uncover purchasing patterns at scale. Segment integrates first-party data flows from multiple sources, connecting insights to help consumer brands understand common buyers’ journeys and attribute performance across the entire purchasing journey.
With Segment’s Linked Profiles, consumer brands can segment customers based on affinity, buying patterns, and sentiment, getting more specific with multi-touch attribution to drive engagement and loyalty.
Data won’t tell you everything
Attribution models are just that — models. Every model has flaws, vulnerabilities, and blind spots. Brands that take quantitative data at face value without leaving room for nuance, insight, and intuition incur more risk, not more safety, in their overreliance on data.
Multi-touch attribution is not perfect — even in the days prior to GDPR, multi-touch attribution models were never an unbiased picture of reality nor a foolproof blueprint for success. Every business uses a slightly different approach to marketing attribution — none are “wrong,” but all of them reflect different priorities and intrinsic biases.
Approaching multi-touch attribution like a model rather than a prescription is key to opening the door to strategic conversations and meaningful insights.
For a well-rounded view of customer behavior, pair quantitative attribution models with qualitative user data from Bazaarvoice. Ratings, reviews, and user-generated content are a goldmine of insights that consumer brands can leverage to understand their audience.
Bazaarvoice’s Insights & Reports tools equip brands with sentiment data, social analytics, and customer feedback trends to optimize the mid-funnel and improve conversion across channels.
Get started