January 11, 2024
When Swiss chocolatier Lindt wanted to determine which images of its delectable products most resonated with its social followers, the brand turned to the insights found in their Instagram analytics. What did they find? That photos of simple, unwrapped chocolate bars outperformed everything else in its feed.
Using this insight, Lindt began giving its followers more of what they wanted. And the move paid off: The chocolate company’s website visits increased by 130%, and its clickthrough rate climbed by 178%.

As a social media manager, you’re well-acquainted with the frustration of decoding what actually resonates with your audience amidst the ongoing changes to Instagram Insights. But whatever your brand’s goal for Instagram — whether it’s to grow followers or increase sales — it’s essential to not only keep an eye on analytics but also to truly understand them.
Knowing what data to look for and how to examine it can help you reach your target audience better, post more engaging content, and develop a more effective social strategy to help you reach your goals and ROI.
This comprehensive guide will take you step by step through Instagram analytics and explain what each metric means and the significance of tracking it, so you can develop a winning Instagram strategy.
Chapters:
- Why you should use Instagram analytics
- How to access Instagram analytics
- Instagram insights you can view
- Individual post analytics
- Instagram Stories analytics
- Instagram product tags analytics
- Making sense of Instagram analytics
Why you should use Instagram analytics
Instagram analytics helps marketers understand three important things:
- People: Who’s engaging with your content?
- Content: What content is engaging?
- Products: Which products within that content are getting the most engagement?
When you consider these collectively — who’s viewing your posts, how your content is performing, and what value your content is driving — you’ll be able to curate your feed in a smarter way and improve your overall content strategy.
Plus, if you’re not looking at the numbers regularly, you may miss key insights and opportunities. For example, you could be posting too frequently or not enough, targeting the wrong audience, or even overlooking comments or mentions that could lead to future partnerships.
How to access Instagram analytics
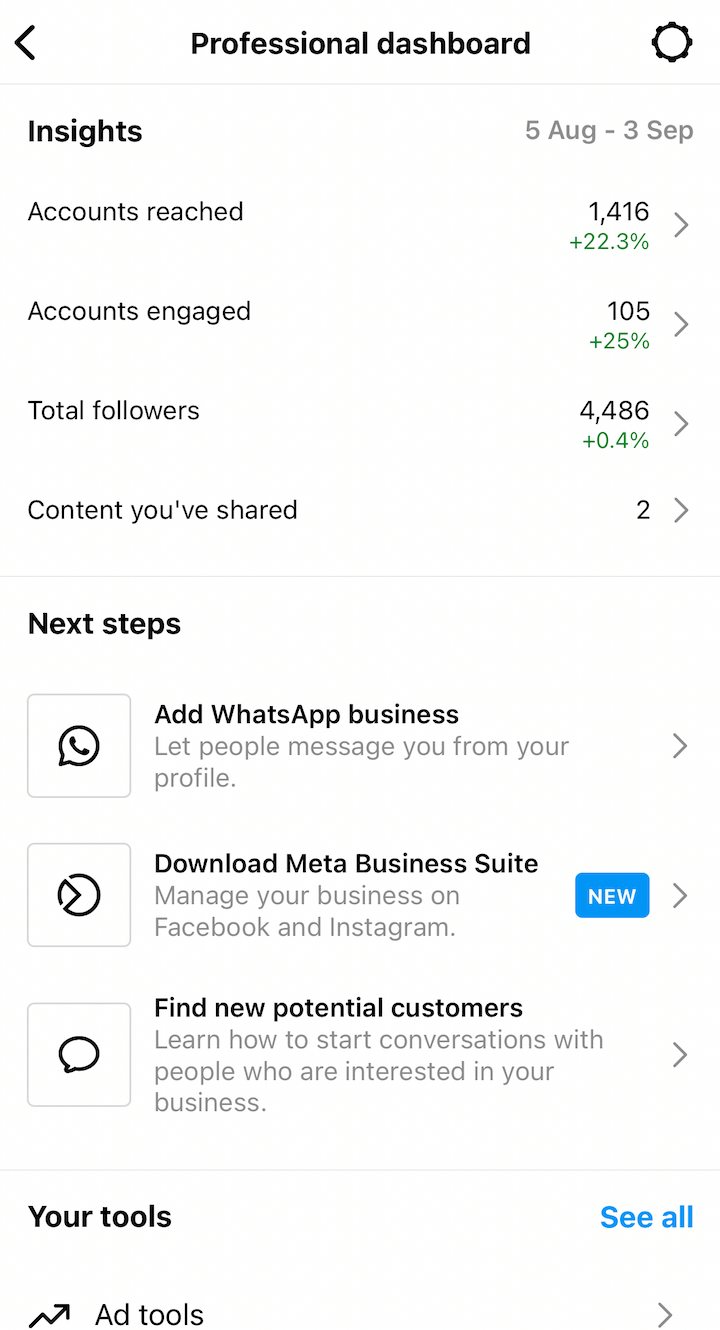
Instagram analytics, which is known as Instagram Insights, is available to business profiles only. You can access analytics from your account profile in one of two ways. First you can access Insights directly from your profile by clicking “Professional dashboard.”

This brings you to a dashboard where you can access insights, tools, and other resources for your business account. To access Instagram Insights from this dashboard, click on the individual metrics at the top of the page to see more information about it. For example, if you want to look at your reach, click “Accounts reached.”
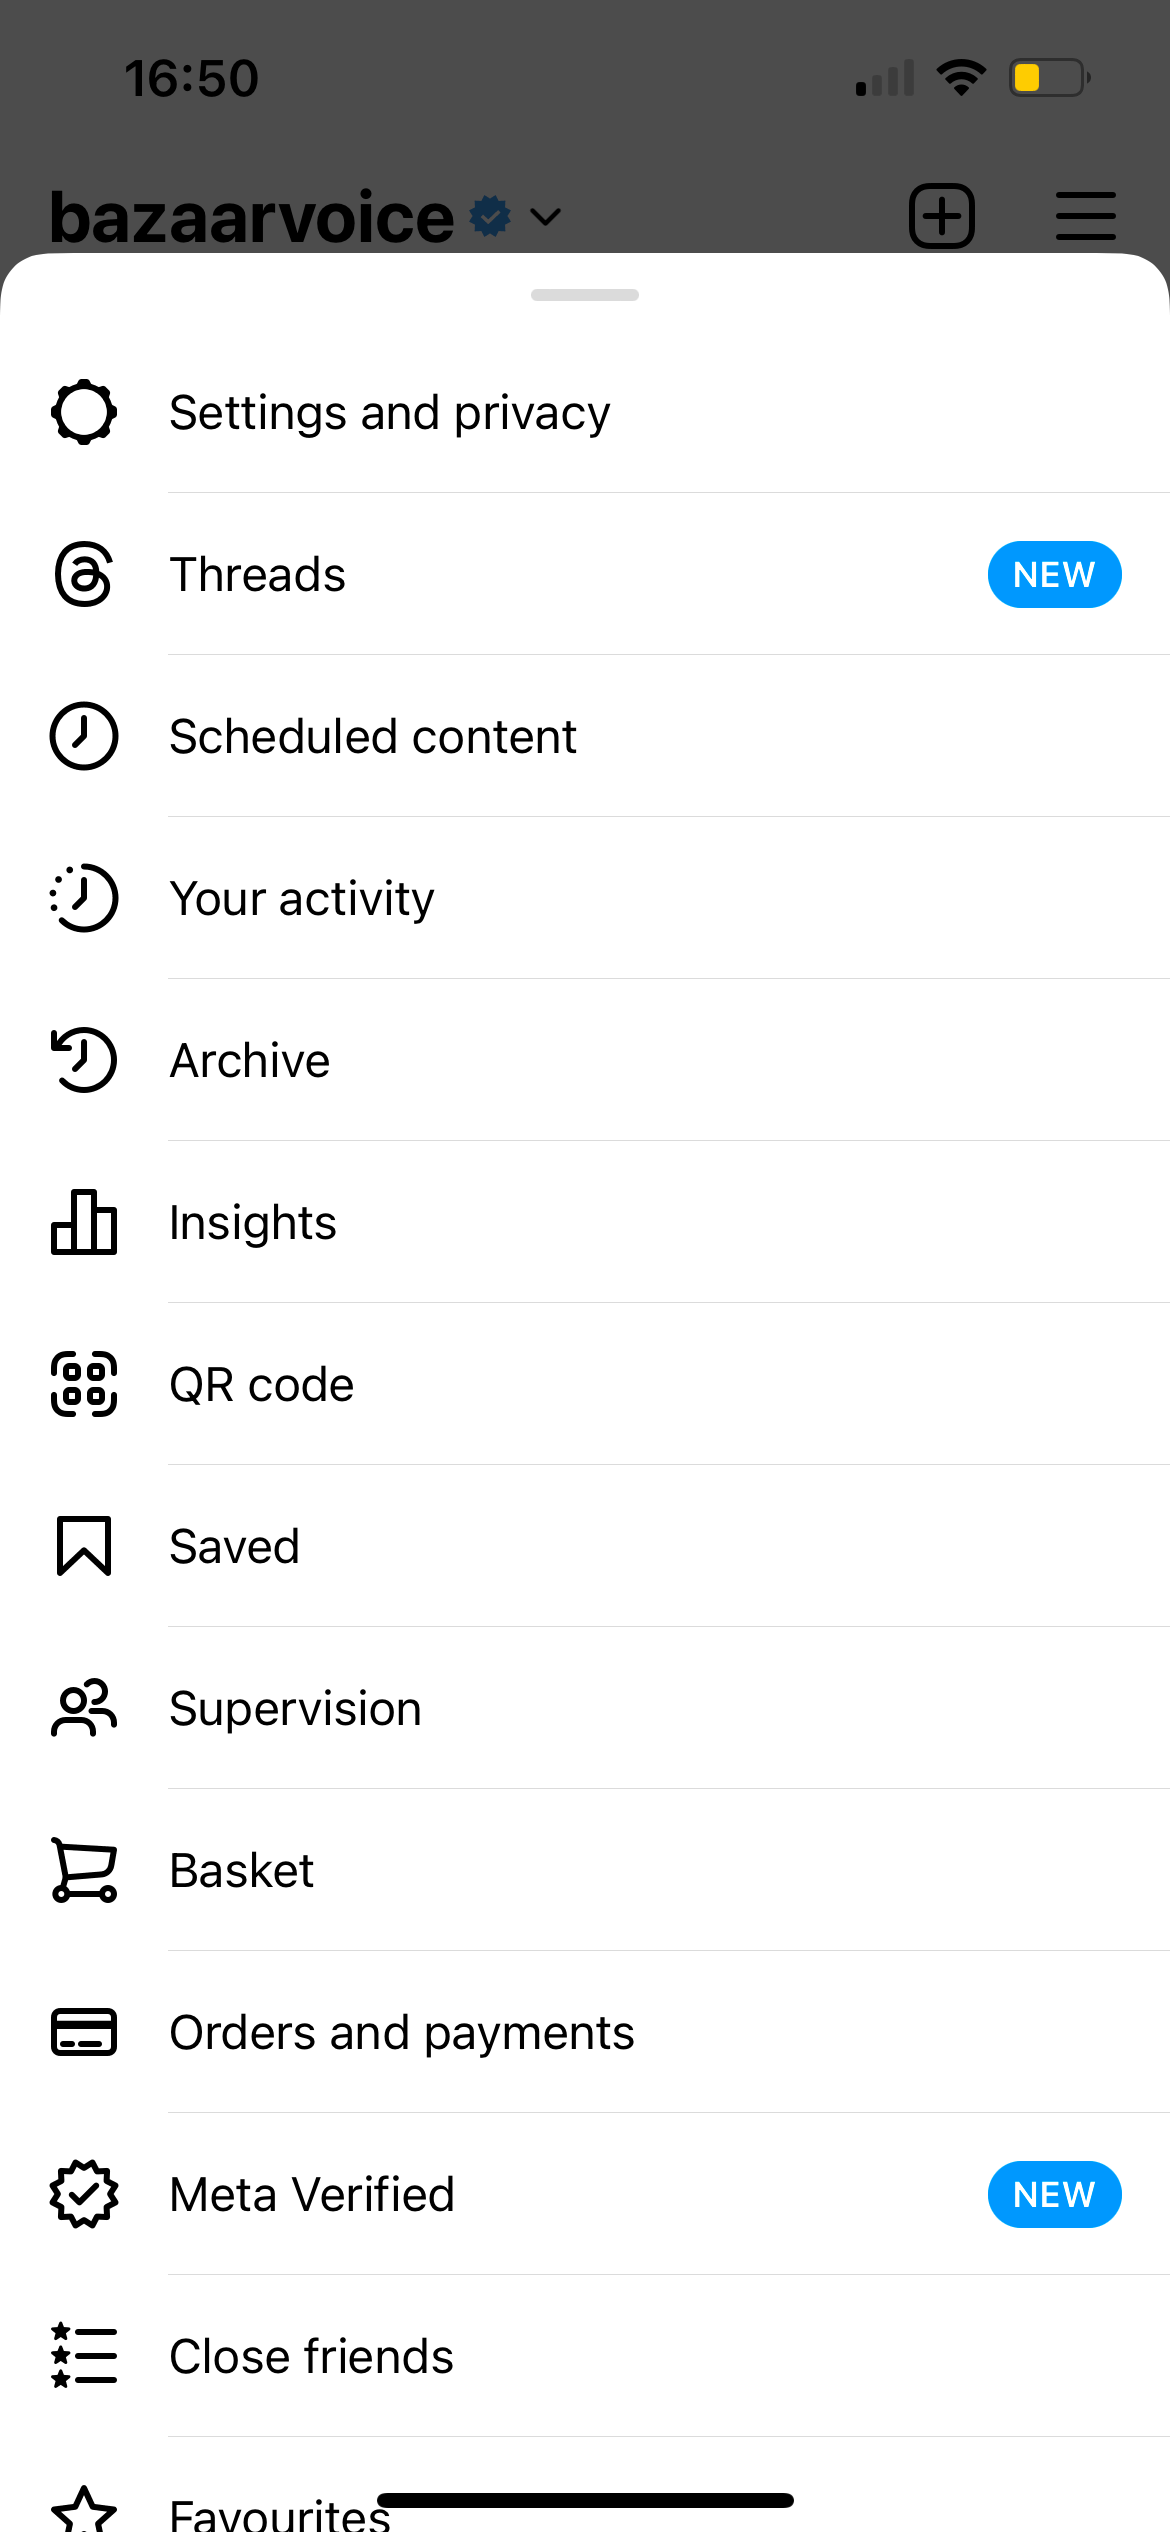
You can also access Instagram analytics by clicking on the three horizontal lines on the top-right corner of the screen and then selecting “Insights” from the list of options.
If you don’t have a business profile yet, follow these instructions to make the switch. If you only recently transitioned to a business profile, you may not have data available yet on Instagram Insights. Also, keep in mind that Instagram can only provide you with analytics information about posts and Stories that you published after you switched to a business profile.
Up until 2023, you could only see data from the past week. Now, you have the option to look at insights from the past seven days, 14 days, 30 days, three months, six months, 12 months, or two years. 📈
Instagram insights you can view
When you access Instagram Insights, you’ll see three different data groups: reach, engagement, and followers. Within each group, you can dive deeper into even more data.
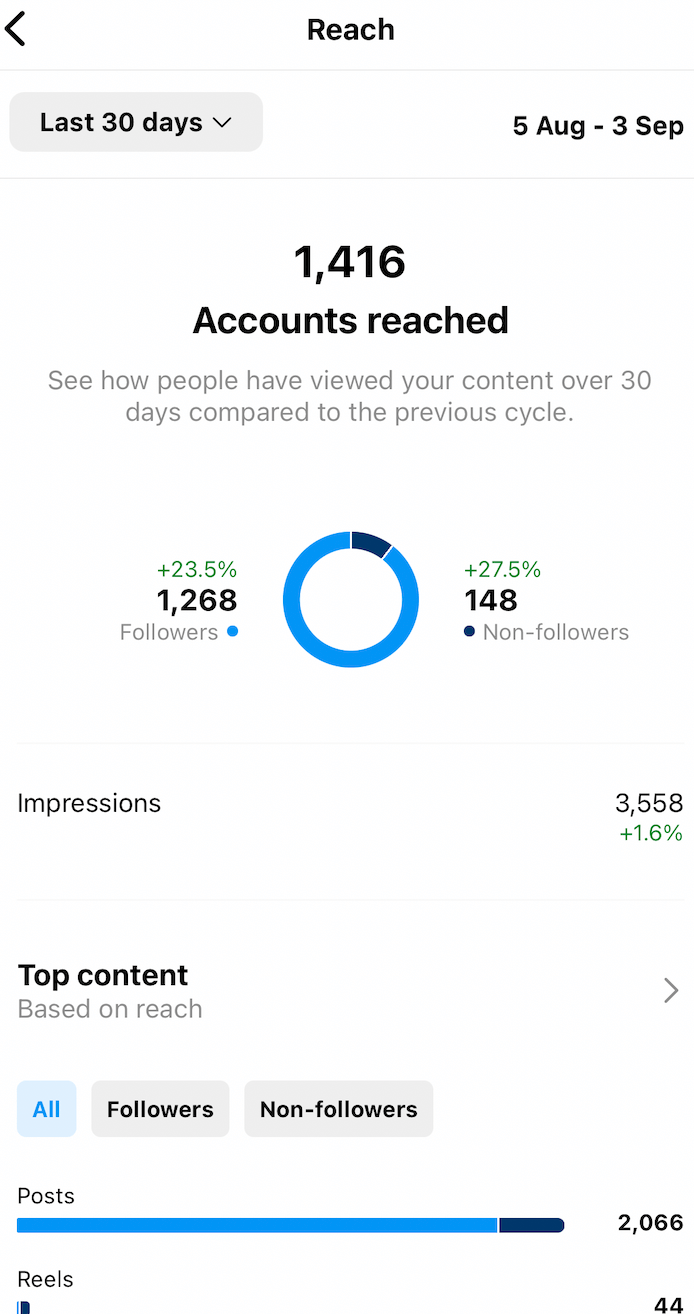
Accounts reached
Under “Accounts reached,” you’ll see the total number of accounts reached and impressions made.
- Reach: How many Instagram accounts your posts reached
- Impressions: Number of times your posts were viewed
At the top, your reach is broken down by followers and non-followers, so you can find out whether you’re effectively reaching your followers. Below that, you can also see an overview of the demographics of the audiences you’ve reached, including their city, country, age range, and gender. (You’ll be able to see a more in-depth breakdown of this information in the “Total followers” section.)
Under the demographics, you’ll see a “Profile Activity” section. Within this section, you can see how many profile visits and external link taps were made during a specific time period. If you have email, phone number, and/or text options set up from your profile, you can also see how many times those were clicked.
- Profile visits: Number of profile views for the week
- External link taps: Number of times someone clicked on the link in your Instagram profile
- Call button taps: Number of times your phone number or “Call Now” button was clicked
- Email button taps: Number of times users clicked the “email” button on your profile page
- Text button taps: Number of times your text button was clicked
This data in the “Profile Activity” section provides you with an overview of how your audience interacts with your brand each week. For example, if you find that profile visits and website clicks are growing, it’s clear that your audience is active and engaged with your brand. However, if these numbers remain low or even decrease, you’ll want to adjust your strategy and find new ways to get your audience involved.
Why the “Accounts reached” tab matters
These numbers provide a good overview of how your content is performing in terms of how many people it’s reaching and how many views it’s receiving.
You can use this data to try to discern what may have prompted a change in impressions. Perhaps you launched a new product that week, or maybe you hosted a giveaway that enticed users to share a post to increase their odds of winning.
Identifying what’s working — or not working — for your audience empowers you to improve your strategy.
Accounts engaged
When you view “Accounts engaged,” you’ll see the total number of people who have interacted with your content over a specific time period compared to the previous time period. Instagram breaks this number down by followers and non-followers.
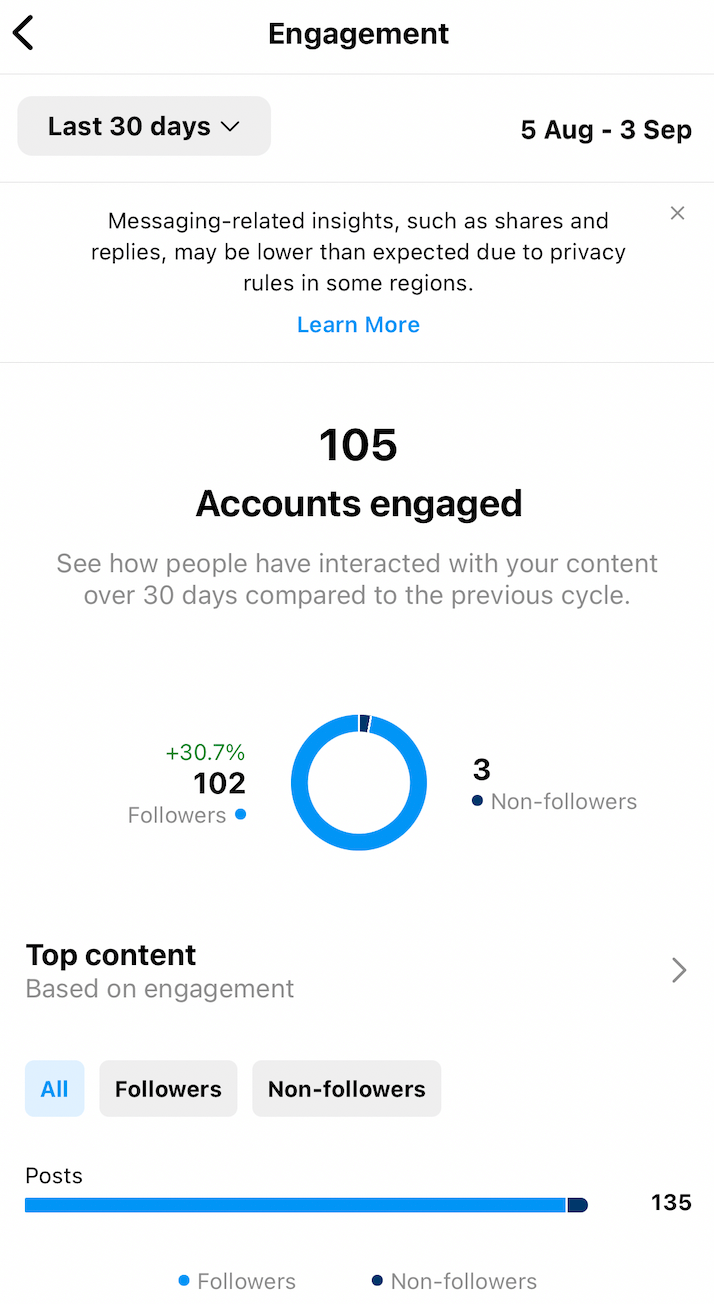
Next, you’ll see a section for “Content interactions,” where you can see the total interactions made with your content. Under the total, your interactions are broken down by the type of interaction that people made with your posts, Stories, and Reels.
For each post and Reel, you can see the likes, comments, saves, and shares. For Stories, you can see the replies, likes, and shares. If you hosted live videos during that time period, you can also see the comments and shares for those videos.
Why the “Accounts engaged” tab matters
Engagement with posts is important because it reveals what type of content is getting your audience’s attention, which allows you to tweak your strategy. For example, if you notice that photos that have a certain style or use a specific filter perform exceptionally well, you may use that tactic more frequently in the future.
Engagement is important for e-commerce brands to track because users who are engaging with your brand are more likely to make a purchase. So, if you have a post that has high engagement, it’s clearly resonating in some way. But can that engagement be translated to conversions? In other words, is there actual engagement with your products?
Total followers
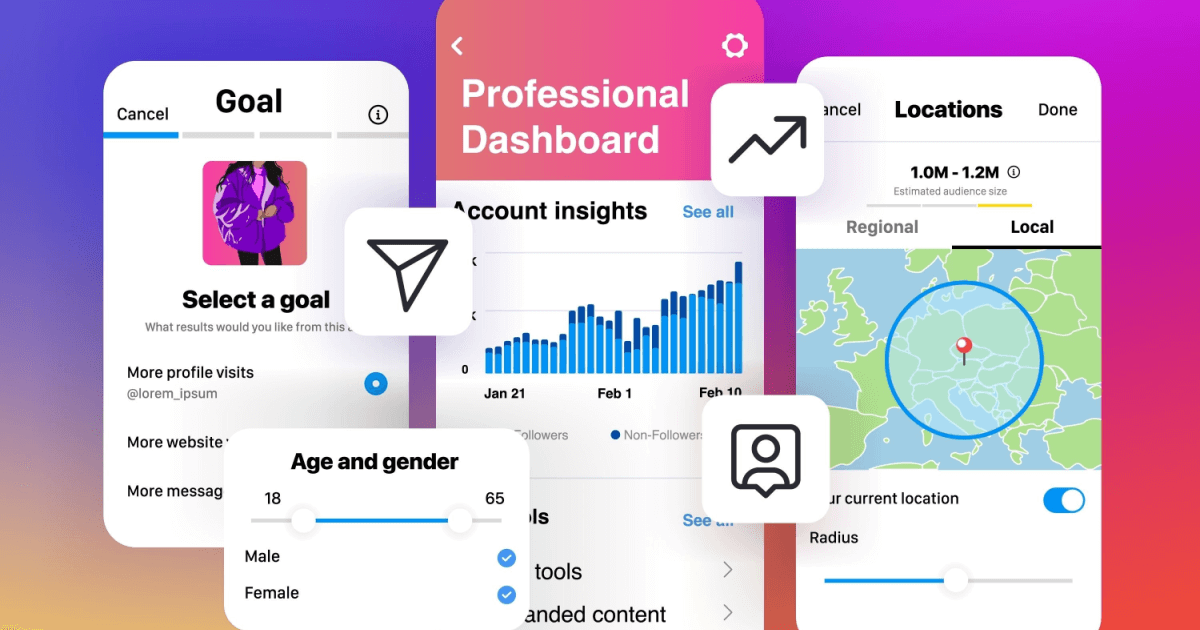
Next is the followers tab. Under this section, you’ll find a more in-depth breakdown of your followers and their demographics.
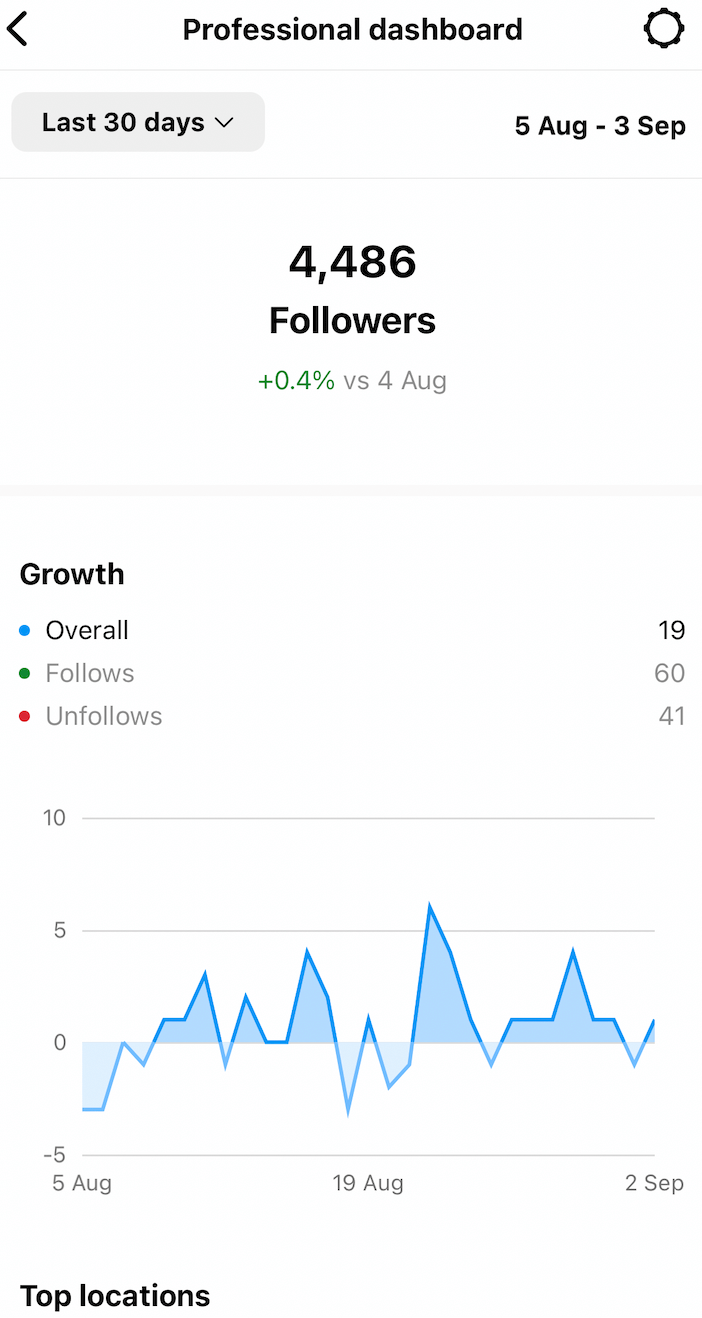
You can see your overall growth, including the number of people who followed and unfollowed you in a specific period of time, then compare it to the previous period.
If you keep scrolling, you’ll find more specific demographics on your audience. You can look at the top locations of your followers by either city or country to find out where the majority of your followers are located. Then you can see the overall age range of your followers or break it down by gender.
Lastly, you can see which times your followers are most active. Instagram breaks this down by both hours and days so you can pinpoint the best times to post your content. For example, if a majority of your followers are active on Fridays at 4:00 p.m., that’s a good time to post in your story and on your feed.
Why the “Total followers” tab matters
This data can inform you if you’re reaching your target audience or perhaps if there’s an audience for your content or product that you weren’t previously aware of. For example, if you find your audience is in a younger age range, you may want to post to Instagram or Instagram Stories more frequently because younger demographics tend to be active on Instagram.
Once you understand more about your overall audience, you can look at individual posts to see how your content resonates.
Understanding the data
When interpreting data from Instagram analytics, it’s important to have goals in mind so you can determine if your content is accomplishing them:
- If your goal with Instagram is to build brand awareness, you’ll want to pay particular attention to metrics like your follower count, impressions, reach, and the number of likes and comments your posts receive
- If you’re trying to drive traffic to your website and you have high engagement but no profile clicks, you may want to consider ways to use your posts to entice followers to visit your profile and click
Now that you can compare Instagram data from the previous month and quarter, you can track and monitor more closely whether you’re making progress toward your goals in the long term.
Questions to consider
Is your follower count growing, shrinking, or remaining stagnant? While some fluctuation in numbers is normal, if you see a sudden increase in followers, it’s worthwhile determining what led to it. Did an influential user tag you in a post? Has the type of content you’re posting changed?
Which posts receive the most impressions or have the greatest reach? Do your posts about products get a lot of attention, or do posts by micro-influencers perform better? Are users engaging with your branded content, or do one-off posts outperform them? If it’s the latter, how can you optimize branded content for engagement?
Are you reaching your target audience? Look at your audience data to determine whether you’re reaching key demographics. If not, what adjustments should you make? What audience are you already reaching, and how might this affect your brand?
How often should you post? Experiment with posting just once a day, and then try posting more often. Compare the amount of engagement that you get at different posting frequencies because different audiences will have different appetites for content.
Individual post analytics
If you want to take a look at how a particular post has performed, you can easily do this by selecting the post and clicking “View insights,” as illustrated below.
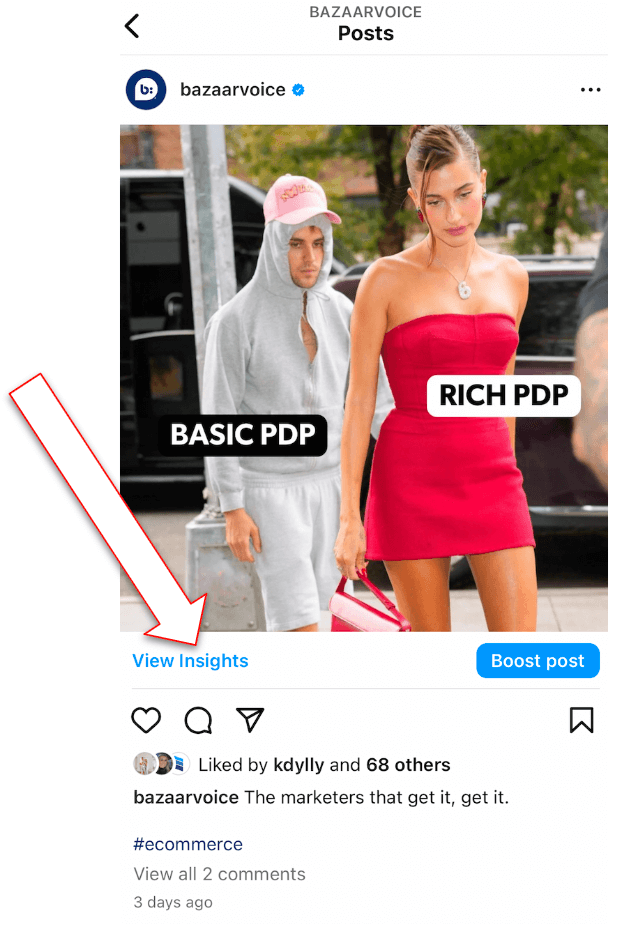
Here, in addition to viewing how many likes, comments, shares, and saves a post has received, you’ll be able to delve even deeper into the post’s performance.
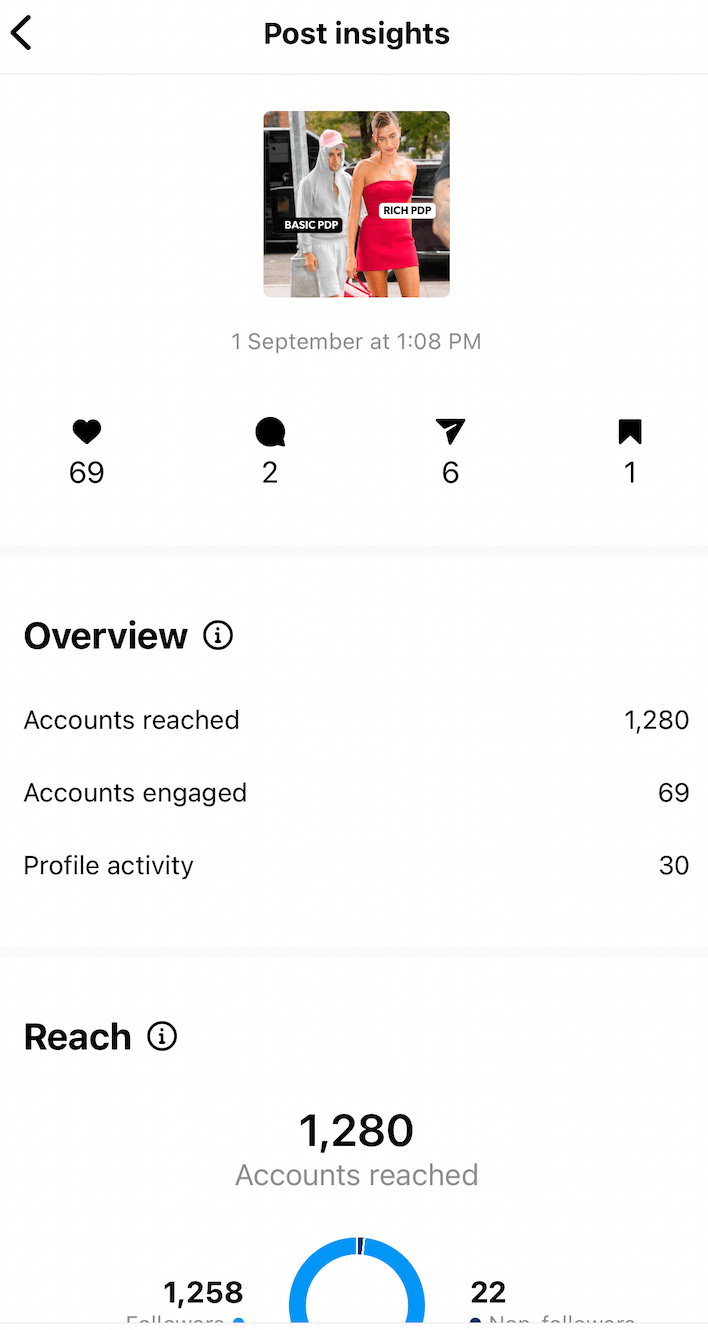
Once you’re in the “Post insights” dashboard, you’ll see an overview of the post’s performance. Below the overview, you’ll see headings for “Reach,” “Engagement,” and “Profile activity.” Within these sections, you’ll see how many unique Instagram accounts you reached, how many users followed you from that post, and where the post garnered impressions.
Understanding the data
Drilling down into how a specific post performed can reveal a great deal of information:
- If certain types of posts, such as product photos, lifestyle photos, or graphics, are receiving more engagement, you’ll want to post more of these and see if you can recreate that success
- If your Instagram is shoppable, you may find that close-up photos of your products get more clicks than images featuring lots of different products in a “shop this look” format
Questions to consider
Which posts are generating the most interactions? Which ones are garnering the most profile visits, website clicks, or emails? Which ones are getting the most reach and attracting new followers?
How are users finding your posts? Are they coming to your profile and viewing content from there? Or are they discovering your content through hashtags?
Instagram Stories analytics
There’s a couple of ways you can see how your Stories are performing, depending on whether you want to view data on current Stories or see historical data from Stories after a 24-hour period.
To see historical information about Stories, simply access Instagram Insights the same way: by visiting your account profile, clicking on the three horizontal lines in the top-right corner of the screen, and selecting “Insights.” Then, click on “Content you shared.”
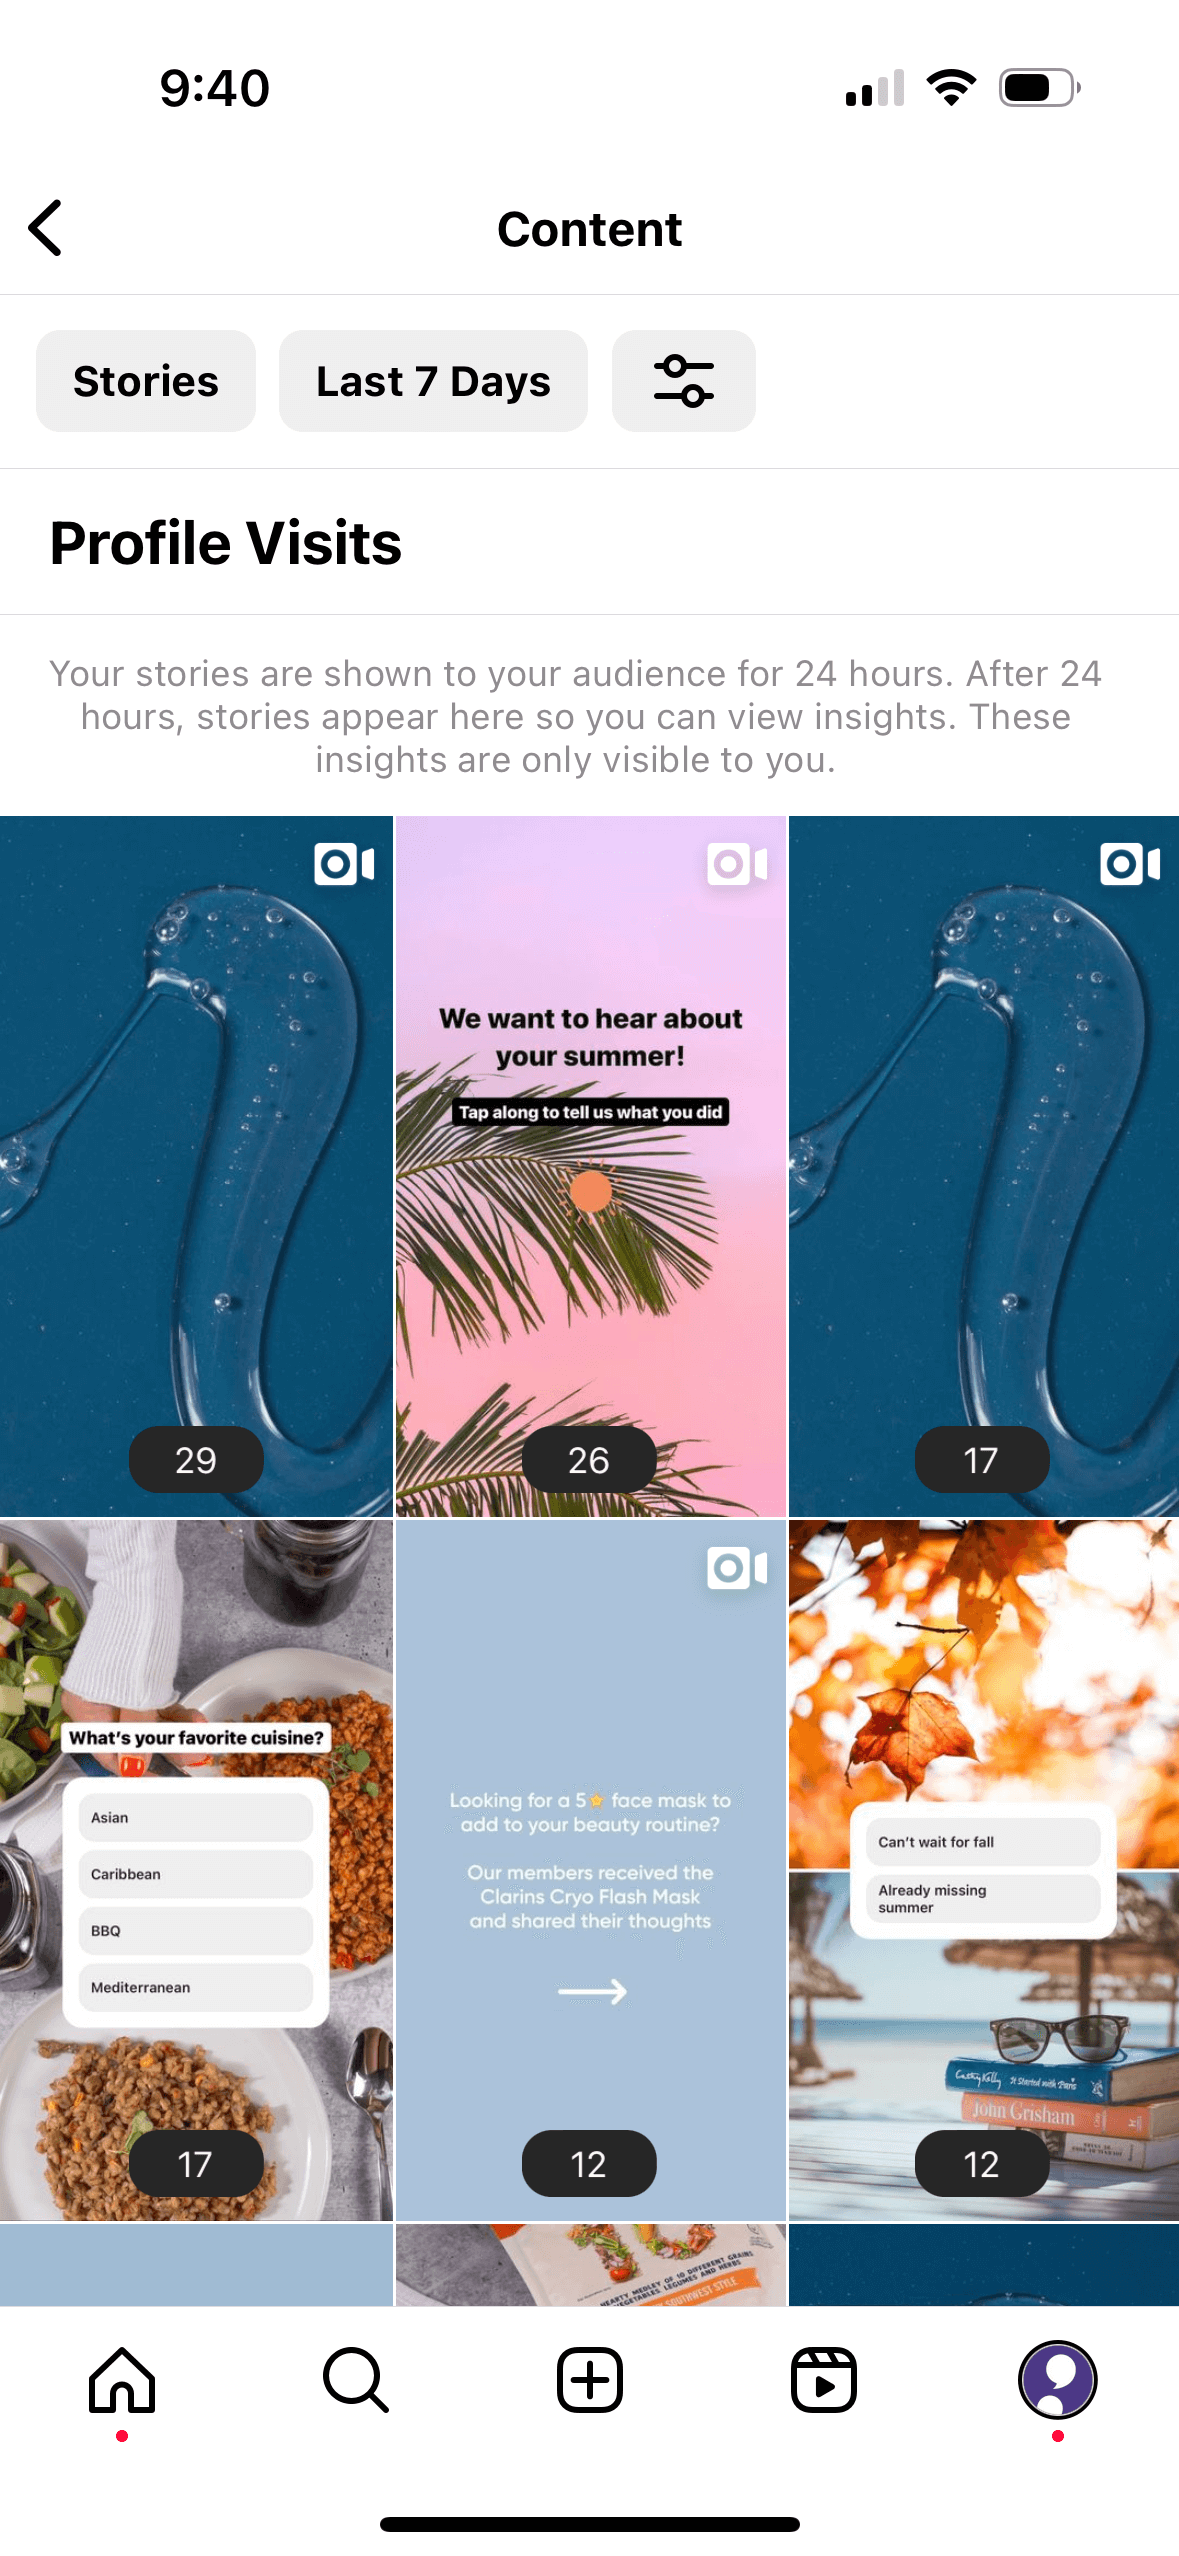
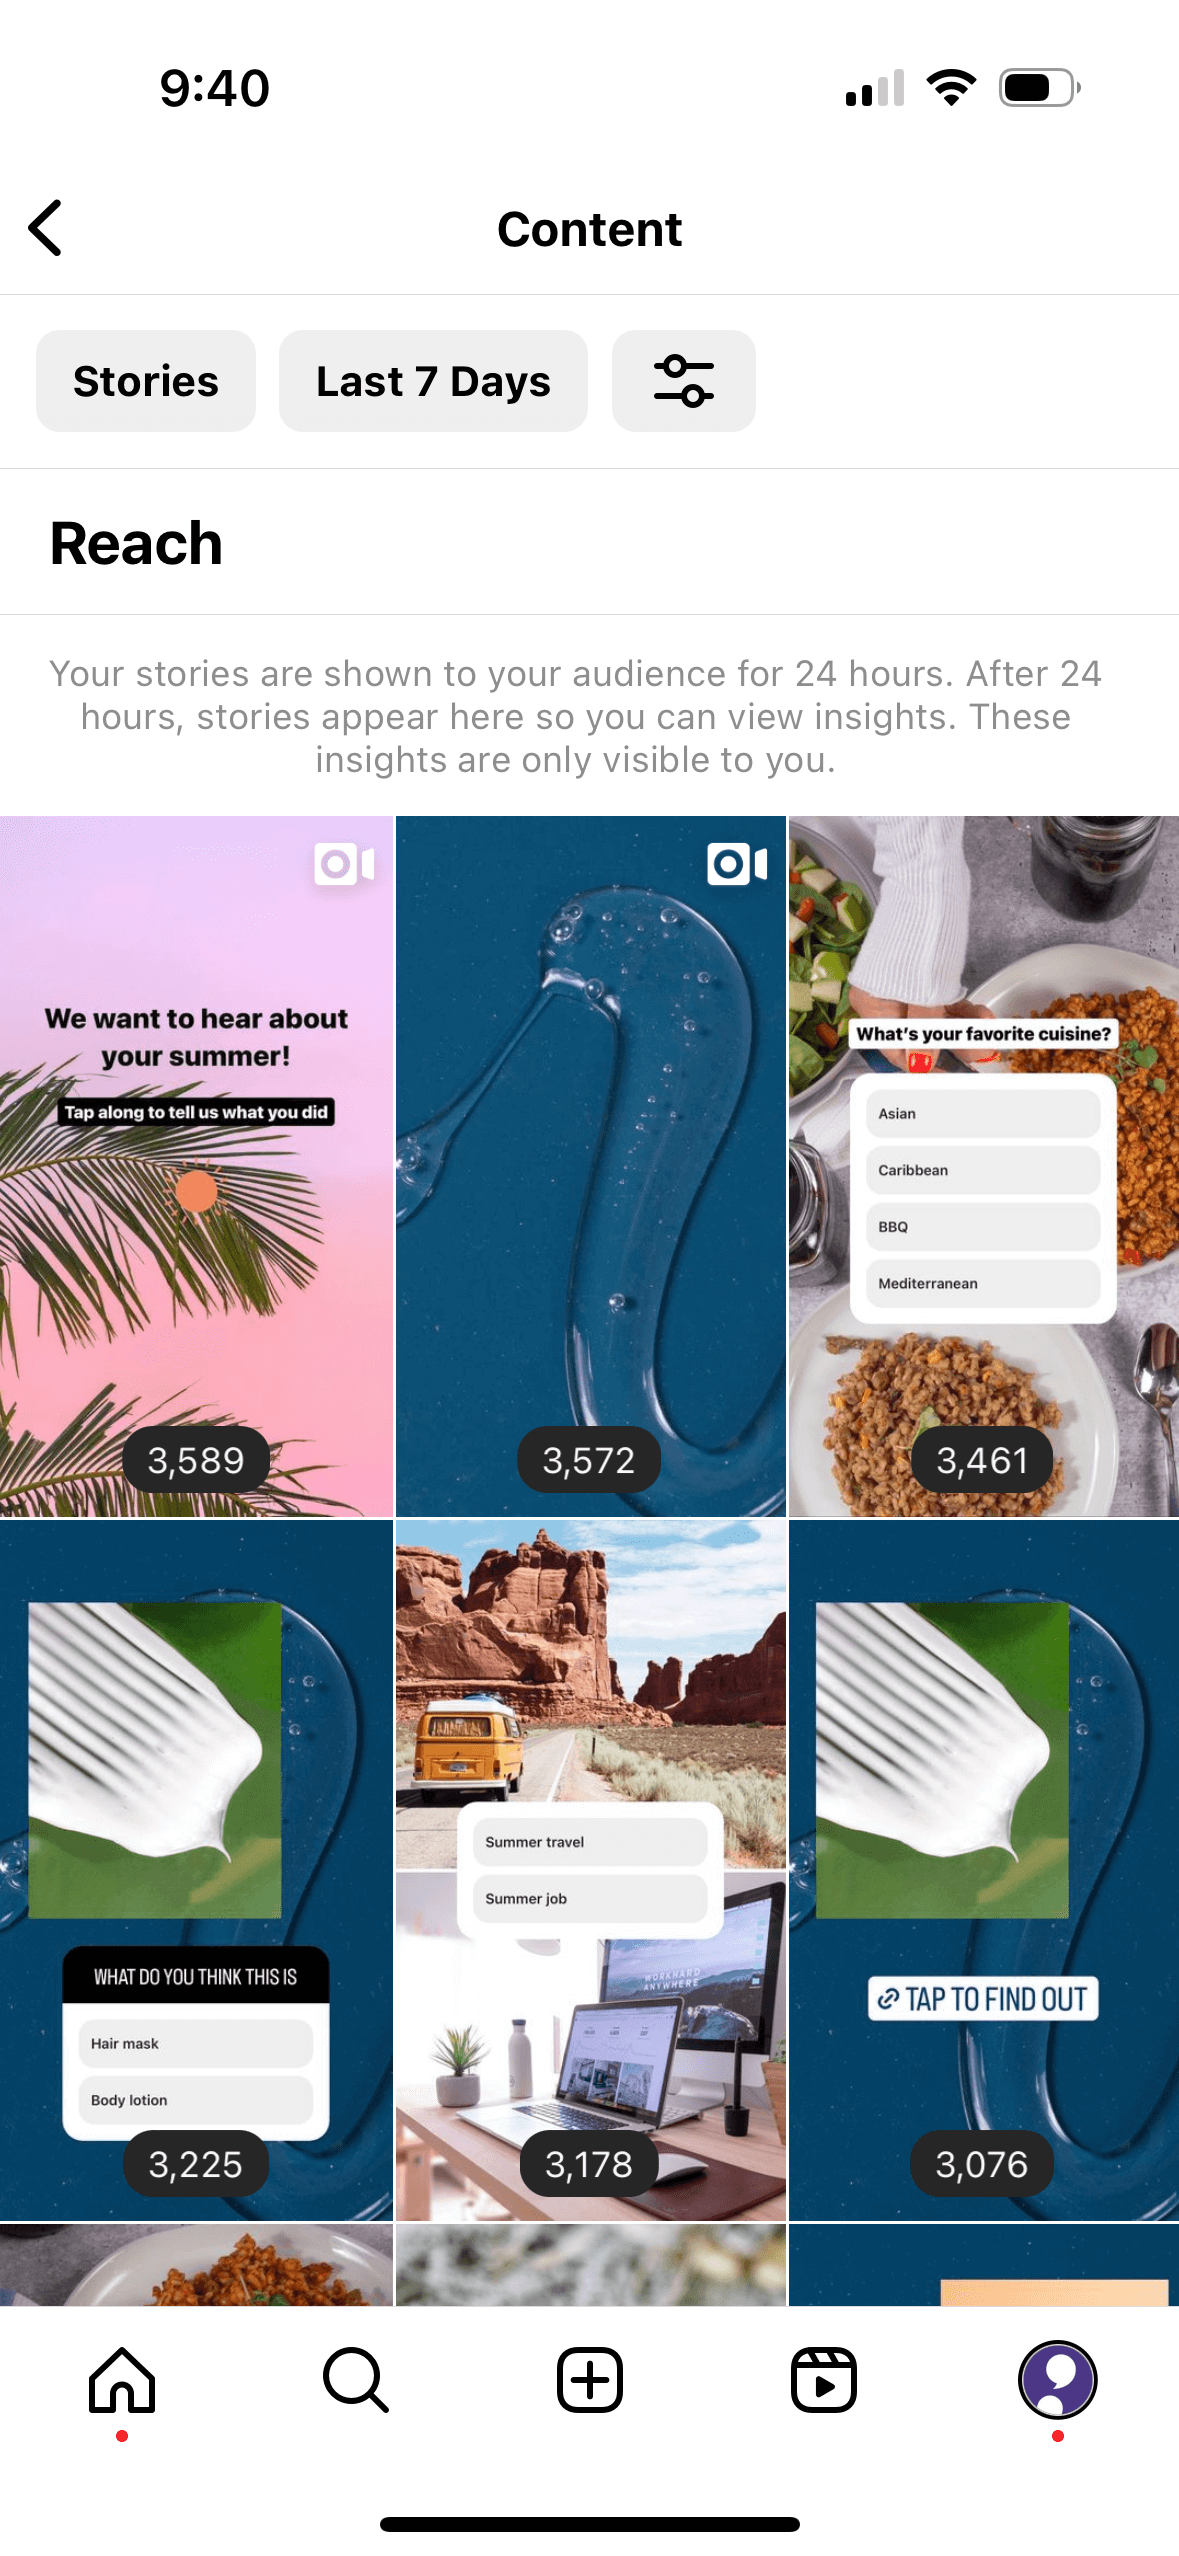
Under the “Content you shared” section, you can narrow the insights down to just story posts and see the number of impressions your Stories received during a certain time period. For story posts, you can choose from six different time periods: the last seven days, 30 days, three months, six months, 12 months, or two years. To see how an individual story has performed, simply select it and then swipe up to reveal more in-depth data.
To access information about an active story, simply tap on the story you’re interested in and either swipe up or tap “Activity” in the lower left-hand corner. From here, you’ll be able to view a variety of data, which is outlined in the following section.
Instagram Stories metrics
Instagram provides a lot of information about who’s watching your Instagram Stories and how those viewers are interacting with them.
Viewers and Reach
To see who viewed an individual story on your account, click the eye icon (eyecon?). This will display a complete list of every Instagram user who saw the story.
Reach shows you how many total accounts you reached with a particular story post. Under Reach, you’ll also find data for Impressions — or the number of views your story received. This is again broken down by followers and non-followers.
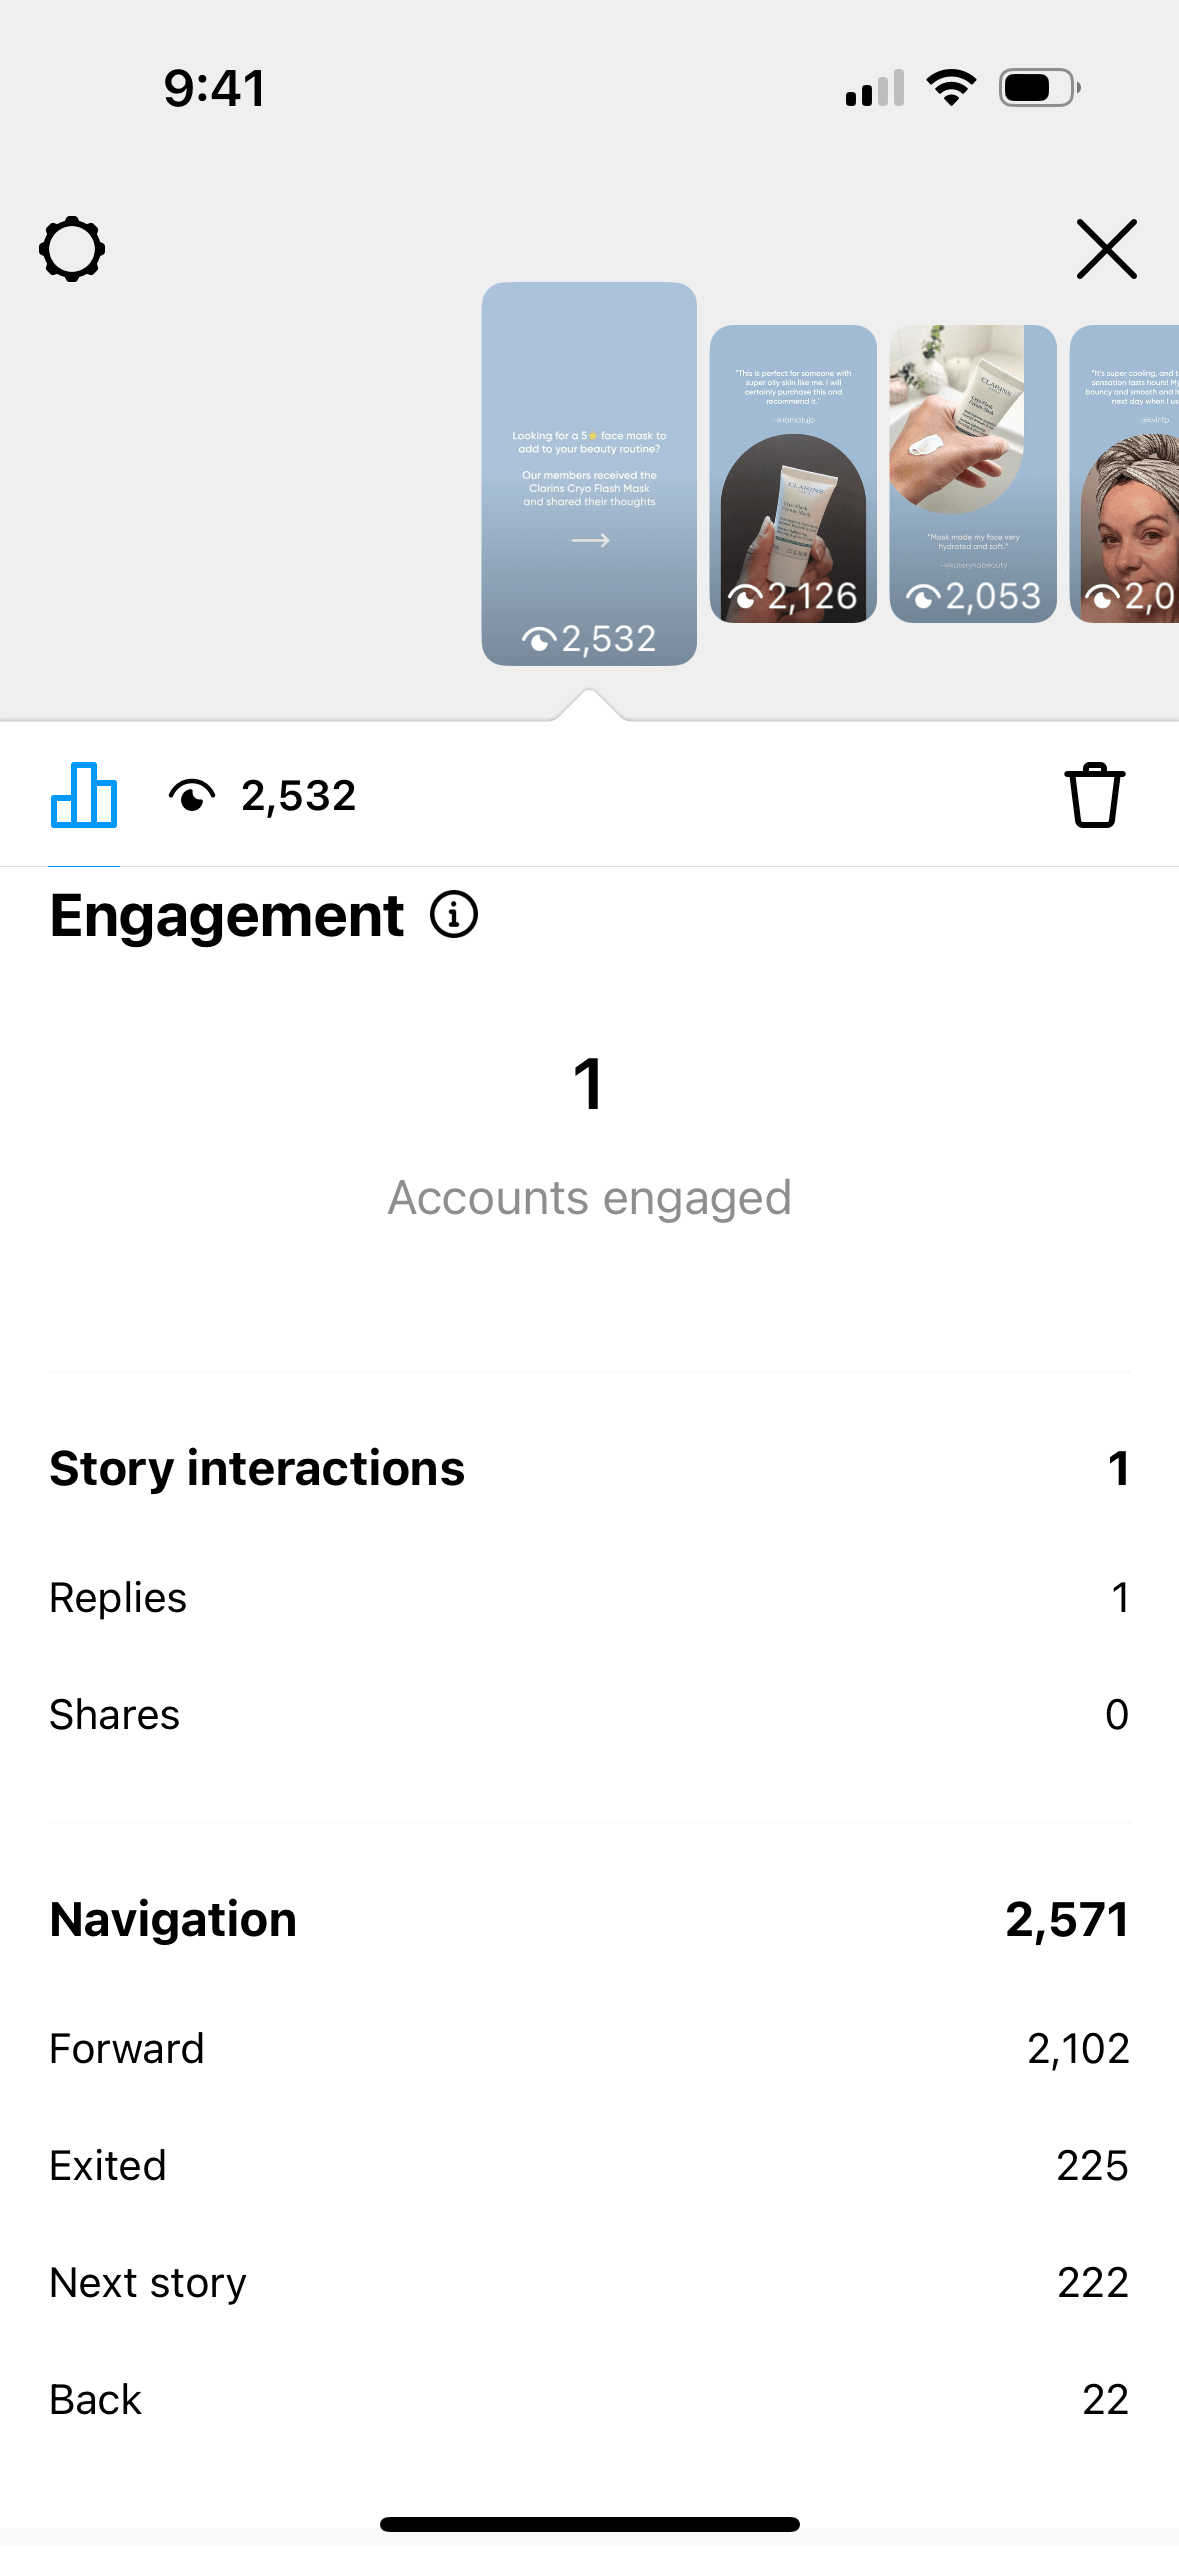
Engagement
Beneath Reach, you’ll find a section of data called Engagement, which details the number of accounts reached with an individual story. Here, you’ll find the following metrics:
- Story interactions: How many users: replied to your story, shared your story, liked your story
- Navigation: How many users: tapped back, tapped forward, tapped on your next story, exited your story (tapped the x icon, swiped to another account’s story, returned to their own feed, or closed the Instagram app)
- Product button clicks: The number of times someone visited a product page from your story and then tapped the button on the product page
- Link clicks: The number of times people clicked on a link in your story
- Sticker taps: The number of times people clicked on a hashtag, location, mention, or product sticker in your story
Profile activity
At the bottom of your story insights dashboard, you’ll find data on your profile activity. This includes the following metrics:
- Follows: Number of users who followed your account from the story
- Profile visits: The number of times someone visited your profile from a story post
Understanding the data
The data you gather from Stories will show you how engaging these posts are for your audience.
For example, if you find that users watch your Story posts when you post behind-the-scenes updates but exit quickly when you promote products, you may determine that users want to engage with your brand but are put off by your sales tactics.
Or if you discover that certain Stories get substantially more clicks back, meaning people are watching the story again, consider what about that content is appealing to users so you can recreate it in future Story posts. When considering your Instagram Stories analytics, again, consider your goals for the platform:
- If your goal with Instagram Stories is to engage with users in a more personal way, pay attention to how many users are sharing or replying to your story posts
- If you’re using Stories to drive traffic to your website, you’ll want to see how many people are swiping up to visit the URLs you’re linking to within your posts
While Instagram now gives businesses access to Stories data from up to two years ago, it’s helpful to be able to see data for as long as you’ve been on Instagram. Having access to all of your data allows you to compare more effectively so you can pinpoint patterns and trends you see over long periods of time and adjust your content according to what resonates most with your audience.
For what it’s worth, Bazaarvoice offers a solution to Instagram’s limited capabilities:
- Bazaarvoice’s dashboard provides unlimited access to Instagram Stories analytics — the data will never disappear
- You can schedule Instagram Stories in advance based on AI feedback to optimize views
Questions to consider
What kinds of Stories are holding your audience’s interest? Identify which of your posts get the most engagement and look into the reason those are performing so well. Do the posts with the most engagement have stickers? Do they have faces? What is it about the engaging posts that your non-engaging posts don’t have? You can also experiment with a variety of story stickers — videos, polls, Q&As, and more — to determine what works best for your brand.
At what point are users exiting your story? This information can help you develop a strategy for your story posts. For example, if you’re uploading numerous photos or videos to tell a more lengthy or complex story overall, when do viewers lose interest? Would you benefit from keeping your Stories more succinct?
What posts are enticing users to click? When you include links in your Stories, are there certain types of posts that lead to more clicks? If you’re promoting a product, are people clicking to learn more? If you’re teasing a blog post, are people swiping up to read the full post?
Instagram product tags analytics
Product tags on Instagram allow businesses to tag items for sale in both posts and Stories, making them easily shoppable. Users simply tap on the product’s picture to learn more about the item and make a purchase. This has three key benefits:
- Allows businesses to showcase products
- Enables businesses to drive sales directly from Instagram
- Empowers the buyer to quickly and easily make purchases
Product tag metrics
The metrics available for product tags are essentially the same for Instagram posts or Stories, meaning you can see the engagement and reach. However, you can also see how many clicks your product has received. Here are some additional product metrics you can access via Instagram Insights:
- Product page views: The number of times your product detail pages were viewed via product tags in your feed or story post
- Product sticker taps: A metric only available in Stories — it tells you how many times people clicked on your product sticker
- Merchant tagged: Tells you when someone tags your brand in their feed or story post
- Product tagged: Tells you when someone tags your product in their feed or story post
Product launches
Instagram also helps businesses and creators promote new products by setting up a product launch. Once you initiate a product launch, you can share an alert so people can save reminders for the launch date. You can also allow your audience to preview products ahead of the launch to drum up excitement. You can view all the insights from your product launch in Commerce Manager.
Understanding the data
This feature provides an additional way to evaluate how your business performs on Instagram by allowing you to see which product posts generate the most interest. However, while Instagram’s native shopping feature enables you to make your account shoppable, Bazaarvoice’s shop tags feature enables you to truly maximize the value of your content by distributing it among various outlets.
Questions to consider
Which products are getting the most clicks? You may find that some of your products simply get more engagement than others. Perhaps expensive items receive fewer clicks than more affordable ones because your audience is more likely to make an impulse buy on a less costly item. Or maybe your top-selling item isn’t getting as many clicks on Instagram as a less popular item, and you need to determine why.
Which types of posts are getting the most clicks? Do your product tags perform better in posts or in Stories? Is there something specific about the post that’s getting your audience’s attention? For example, is the product photo or video appealing for a certain aesthetic reason, or is the product teased or promoted in an intriguing way?
Making sense of Instagram analytics
Clearly, there’s a great deal of analytics information available to Instagram users, and it can be challenging to know where to start when you’re first looking at all of the data and trying to make sense of it.
To help make your Instagram analytics experience easier, first consider getting verified on Instagram. Next, consider what your goals are for the platform. If you’re mostly interested in growing your audience and expanding your brand’s reach, you’ll want to focus on followers. Pay close attention to your number of followers, track how that number changes over time, and consider how your content plays a role in the increase, decrease, or stagnation of that number.
However, if you’re using Instagram for e-commerce, you’ll want to focus on other aspects of analytics and consider how you can increase sales, such as by making your Instagram easily shoppable.
Instagram Insights can only provide so much data, though. So, if you’re serious about delving into your Instagram analytics and genuinely understanding what your numbers mean, Bazaarvoice can provide you with the tools to do just that.
Get started