If you are like me, your holiday shopping experience has completely changed this year. During the holidays, I usually start shopping in late November and continue throughout December. I prefer staying away from the crowds of Black Friday, and shopping online for most my gifts. This was not always the case. In the past, I would stand in lines and race through stores to get the exact gifts I needed. Naturally, I thought to myself “are other shoppers having the same experience as me?”
The Bazaarvoice network presents a wealth of data that can provide insight into consumer behavior, so my team decided to analyze the data to see if other shoppers had the same holiday shopping experience as I did. Are other consumers shopping the same way? Has the era of traditional holiday shopping ended?
Thanksgiving
While cooking the big meal, I used my smartphone to research products, read reviews, compare deals, and to look up a recipe for green bean casserole. Mobile shopping has steadily grown each holiday season, so it is no surprise to me that, across the e-commerce landscape, mobile shopping was 52.1% of online traffic on Thanksgiving Day.
When buying a product, I look at the number of reviews (if a product does not have reviews, I don’t consider it). Our research has actually found that 28% of product page visitors interacted with reviews. After that, I consider the product’s average rating, then the content of the reviews. Bazaarvoice has found that most consumers follow this same approach. But it’s not just the presence of reviews that counts; volume also is important. In one study, we saw an average 27.8% increase in orders when review volume went from one review to 15 reviews, and product rating from 3.5-4.5 stars. Benchmarks from these studies show that adding just one review to a product with no reviews can increase sales by 10%, and going from no reviews to 50 can increase sales by 30%.
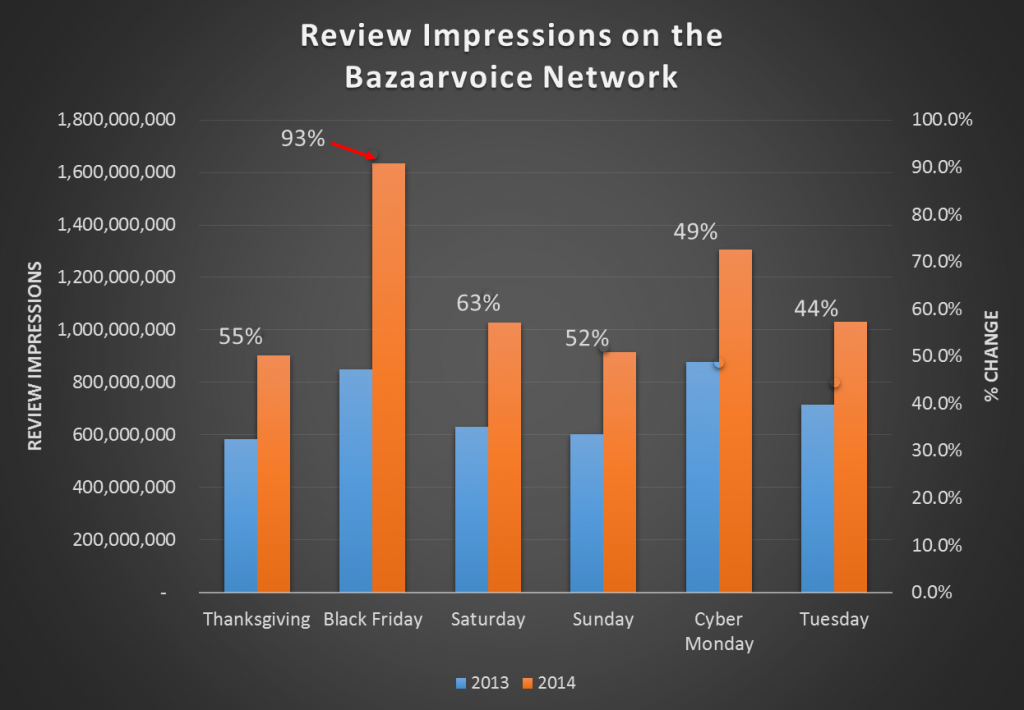
After dinner, I spent the rest of my evening refining my shopping list by choosing specific models & comparing prices. This appears to be a common behavior this season. We found that traffic in the Bazaarvoice network on Thanksgiving increased 29% compared to 2013, serving 903 million review impressions (an increase of 55%). Shopper traffic peaked between 4 – 11 PM.
Black Friday & Cyber Monday: By the numbers
The Bazaarvoice network averaged 58.6 million daily unique visitors throughout the holiday weekend. At 73.2 million on Black Friday, our network saw a 59% increase from 2013. By comparison, ComScore reports that Amazon saw a 25% increase from their 7.7 million visitors last year.
Unique visitors is an important measure of traffic, but just as important is how they use the content provided in the Bazaarvoice network. In 2013, we found that Black Friday and Cyber Monday were the most review-trafficked days of the year, beating the November daily average review pageviews by 77% and 84% (The Conversation Index Volume 7).
This year, over 6.8 billion review impressions were served to consumers across the Bazaarvoice network between Thanksgiving Day and Cyber Monday. On Black Friday alone, review traffic in the Bazaarvoice network increased 41% compared to 2013, serving 1.6 billion review impressions (a dramatic increase of 93% from last year). Throughout the holiday weekend, mass merchants, department stores, and apparel retailers led the pack in review impressions served, followed by sporting goods, home improvement, toys, and consumer electronics retailers.
Highlighting the growing importance of social posts, photos, and videos as a way for consumers to validate purchase decisions, we also saw spikes in Curations impressions on both Black Friday (up 83.8%) and Cyber Monday (up 72.1%) compared to Thanksgiving Day.
That begs the question, “What products were consumers looking at most often?” When we looked at the data across the entire Bazaarvoice network, we identified the list of the Top 10 most viewed products for Nov 27th– Dec 1st 2014:
- Panasonic 50” LED HDTV
- The Sony PS4
- Dell Inspiron laptop
- Campbell’s Green Bean Casserole recipe (I know I looked at it while preparing my meal)
- Element Electronics 40″ LED HDTV
- Samsung 55″ LED 2160p HDTV
- Xbox One Assassin’s Creed bundle
- Surface Pro 3
- Nikon Coolpix L330 Digital Camera
- Beats by Dre Solo HD headphones
It’s one thing to know what products are being viewed by consumers in the digital shopping aisle, but the rubber meets the road when consumers’ use of UGC becomes a leading indicator of online sales. For example, our data from Oct 1st – Dec 31st 2013 shows that, on average, time-on-site increases +132% when consumers interact with reviews, which is highly suggestive that consumers are using UGC to gather important information to make a purchase decision. To validate the correlation, we see that product page visitors who interact with review content show the following behavior compared to those who do not interact with reviews:
+92% conversion rate
+107% revenue per visit
+7% average order value
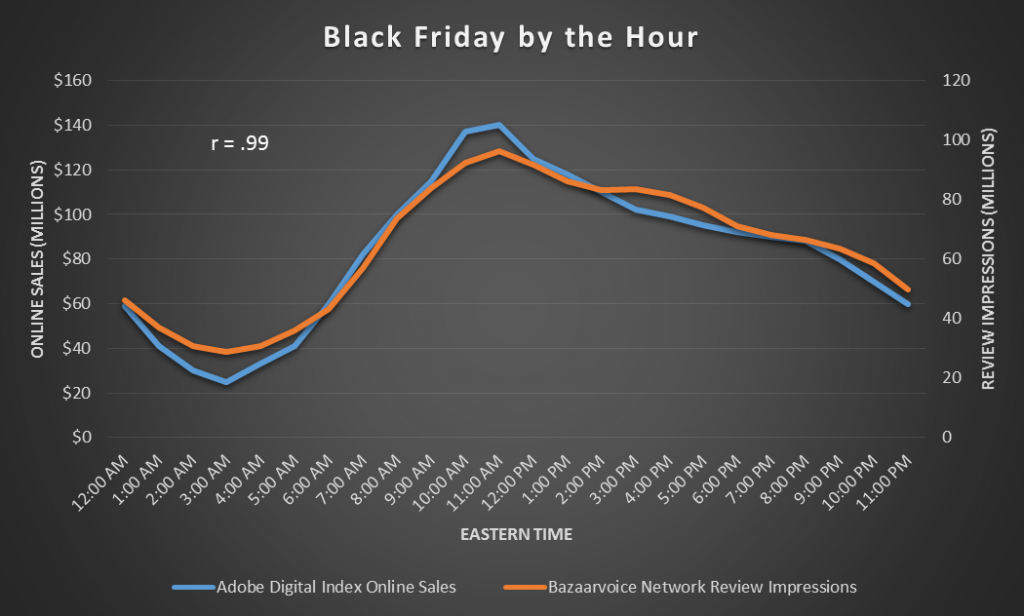
But don’t take just our word for it. According to data from the Adobe Digital Index, Black Friday sales peaked at around 11:00 a.m. Eastern Time, with sales totaling $140 million. As you can see below, review impressions on the Bazaarvoice network are strongly associated with online sales–the peak of 96.2 million review impressions in the Bazaarvoice network aligns with the $140 million peak in online sales identified by Adobe.


