Report
Shopper Preference Report 2025
Read more
Infographic
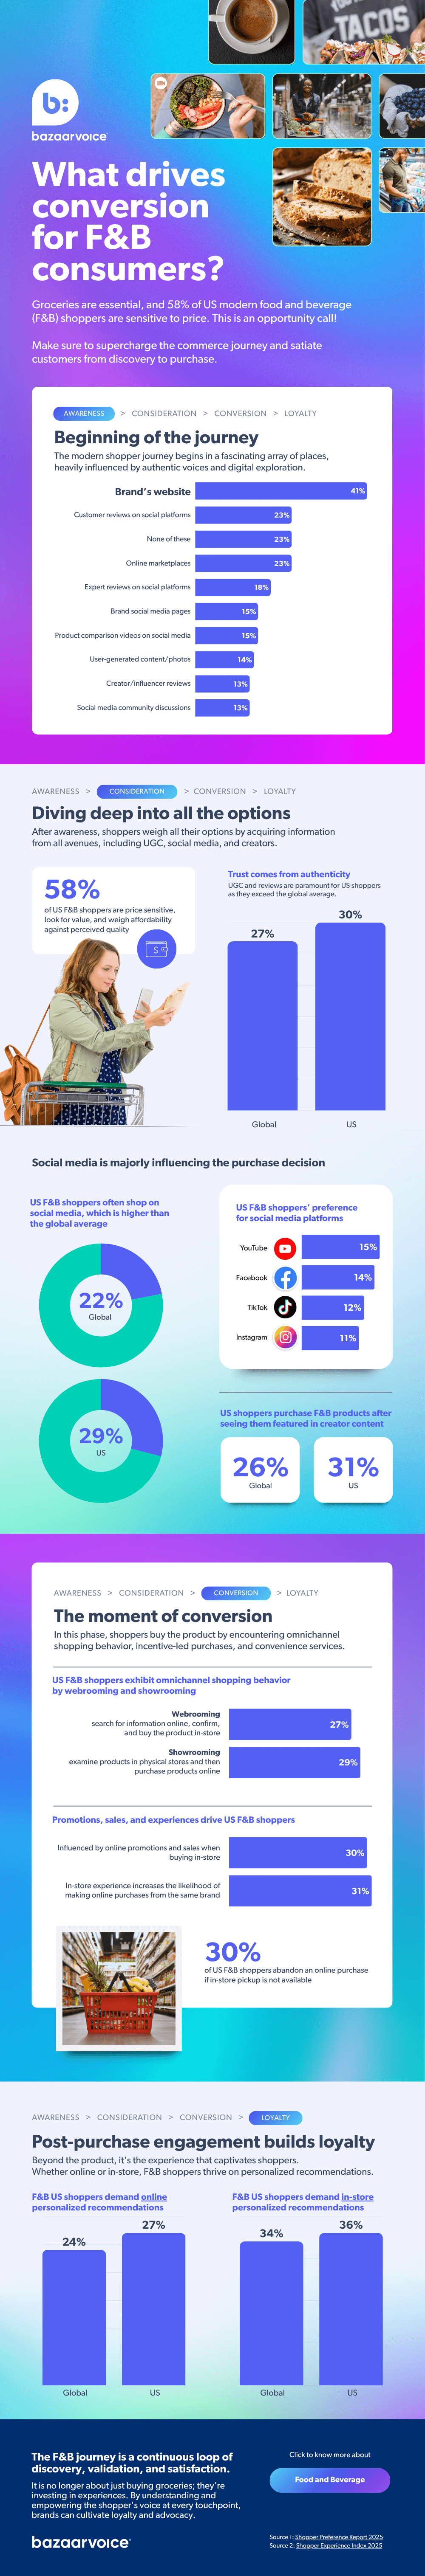
58% of modern food and beverage (F&B) shoppers in the US are sensitive to price.
They are looking for value and affordability, a satiating journey from discovery to purchase. Based on insights from 16,000+ respondents, we found some interesting statistics that can help fuel your commerce engine for your F&B business.
Read the infographic to know more.
Want to learn more about UGC? Check out how we collect, drive, amplify, and optimize authentic content.
Report
Read more
Webinar
The 2020 Shopper Experience Index covers our latest research focused on consumer preferences and shopping activity. Since the onset of COVID-19, we have been closely...
Read more
Report
What are brand pillars? Well, they're the 2nd most important pillar in the world currently, right behind those holding up the Acropolis of Athens. But...
Read more